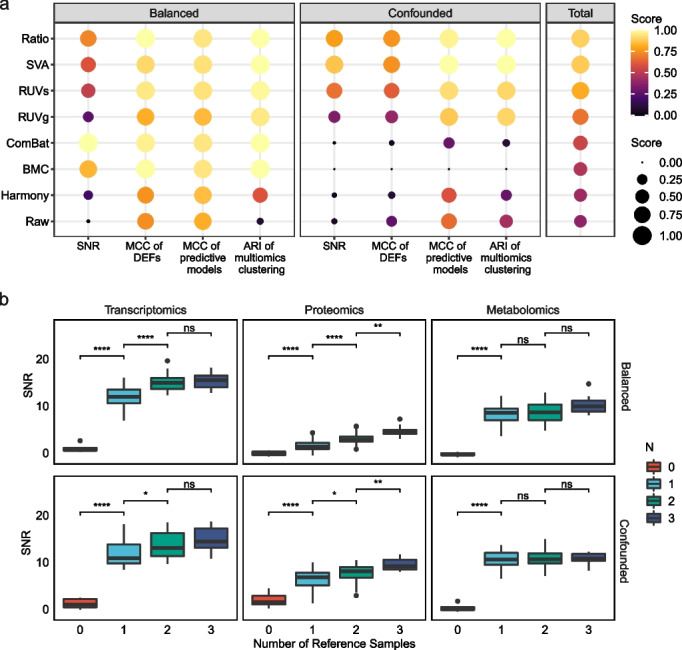
Fig. 6.

Summary of performances of BECAs and choice of number of samples for ratio-based scaling. a The summarized performance of seven BECAs in balanced and confounded scenarios. The BECAs were ordered by their total score. For the calculation of the total score, we first separately scaled the values of the four metrics, including signal-to-noise ratio (SNR), Matthews Correlation Coefficient (MCC) of identification of differentially expressed features (DEFs), MCC of prediction, and Adjusted Rand Index (ARI) of multiomics clustering, to an interval of (0,1) to equalize the weight of different metrics. The total score was expressed as mean of the scaled values of the four metrics. b Boxplot of SNR under different numbers of replicates of the reference sample used as dominators in conducting ratio-based scaling. Student's t-test was conducted. Symbolic number coding of p-value was used as: *** (p ≤ 0.001), ** (0.001 < p ≤ 0.01), * (0.01 < p ≤ 0.05), ns (p > 0.05, not significant)
