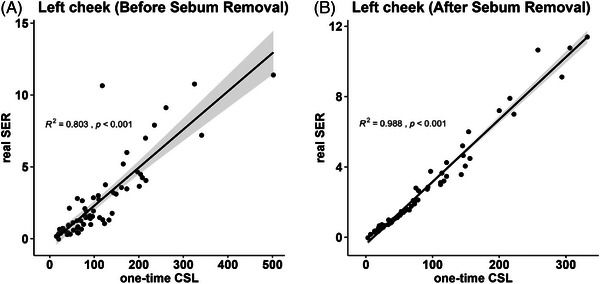
FIGURE 4.

Scatter plots of the one‐time CSL and real SER, showing Spearman's correlation coefficient (R2) and the p value of the left cheek testing point. (A) Before sebum removal. (B) After sebum removal.

Scatter plots of the one‐time CSL and real SER, showing Spearman's correlation coefficient (R2) and the p value of the left cheek testing point. (A) Before sebum removal. (B) After sebum removal.