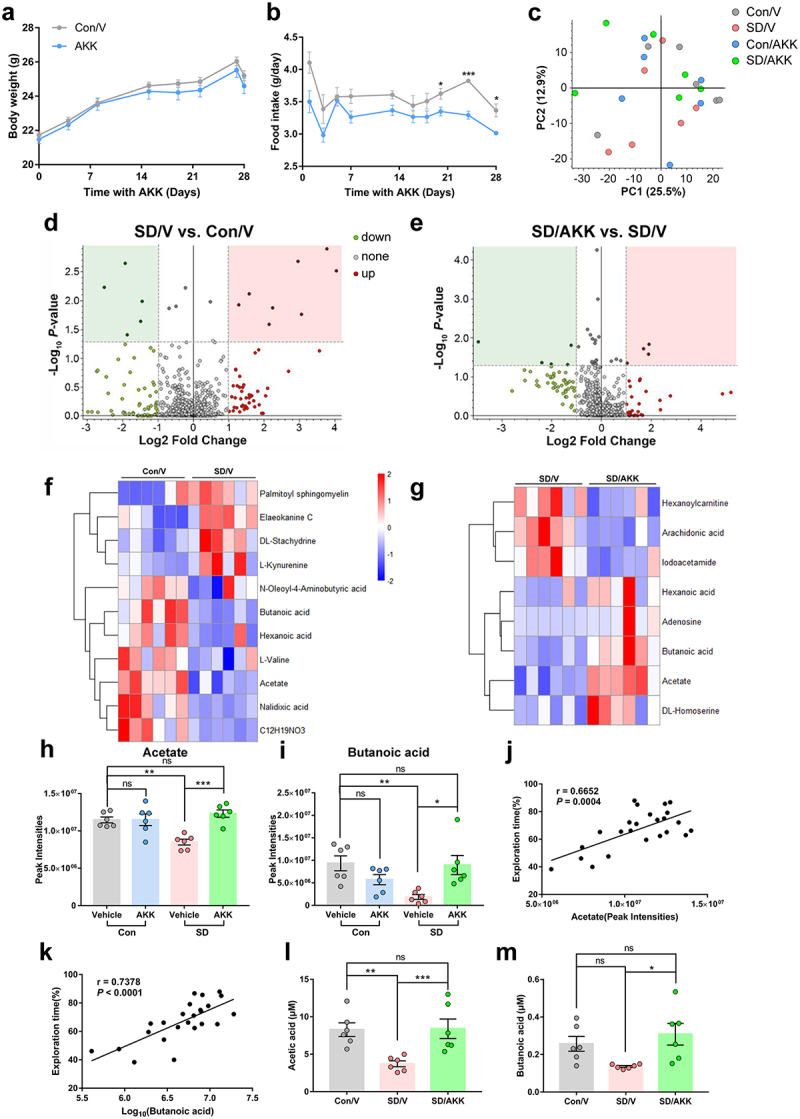
Figure 7.

The effects of A. muciniphila colonization on metabolic dysfunction-associated SD in mice.
(a) Body weight and (b) food intake of control and AKK supplementary mice. n = 12 mice per group. (Two-tailedt-test) (c) Principal coordinates analysis (PCoA) of metabolite profiles in serum samples. (d and e) Differentiation of metabolites between the SD/V and control mice (d), and between the SD/AKK and SD mice revealed by volcano plot (e). The enrichment of representative metabolite in serum upon SD/V (f) and SD/AKK group (g). (h) Acetate and (i) butanoic acid relative levels in the serum of mice. (j and k) The exploration percentage positively correlates with gut metabolites acetate (j) and butanoic acid (k). (l and m) The concentrations of acetate and butanoic acid in the serum of mice. n = 6 mice per group. (One-way ANOVA with Tukey’s multiple comparison tests, *P < .05, **P < .01, ***P < .001, ns, no significant difference).
