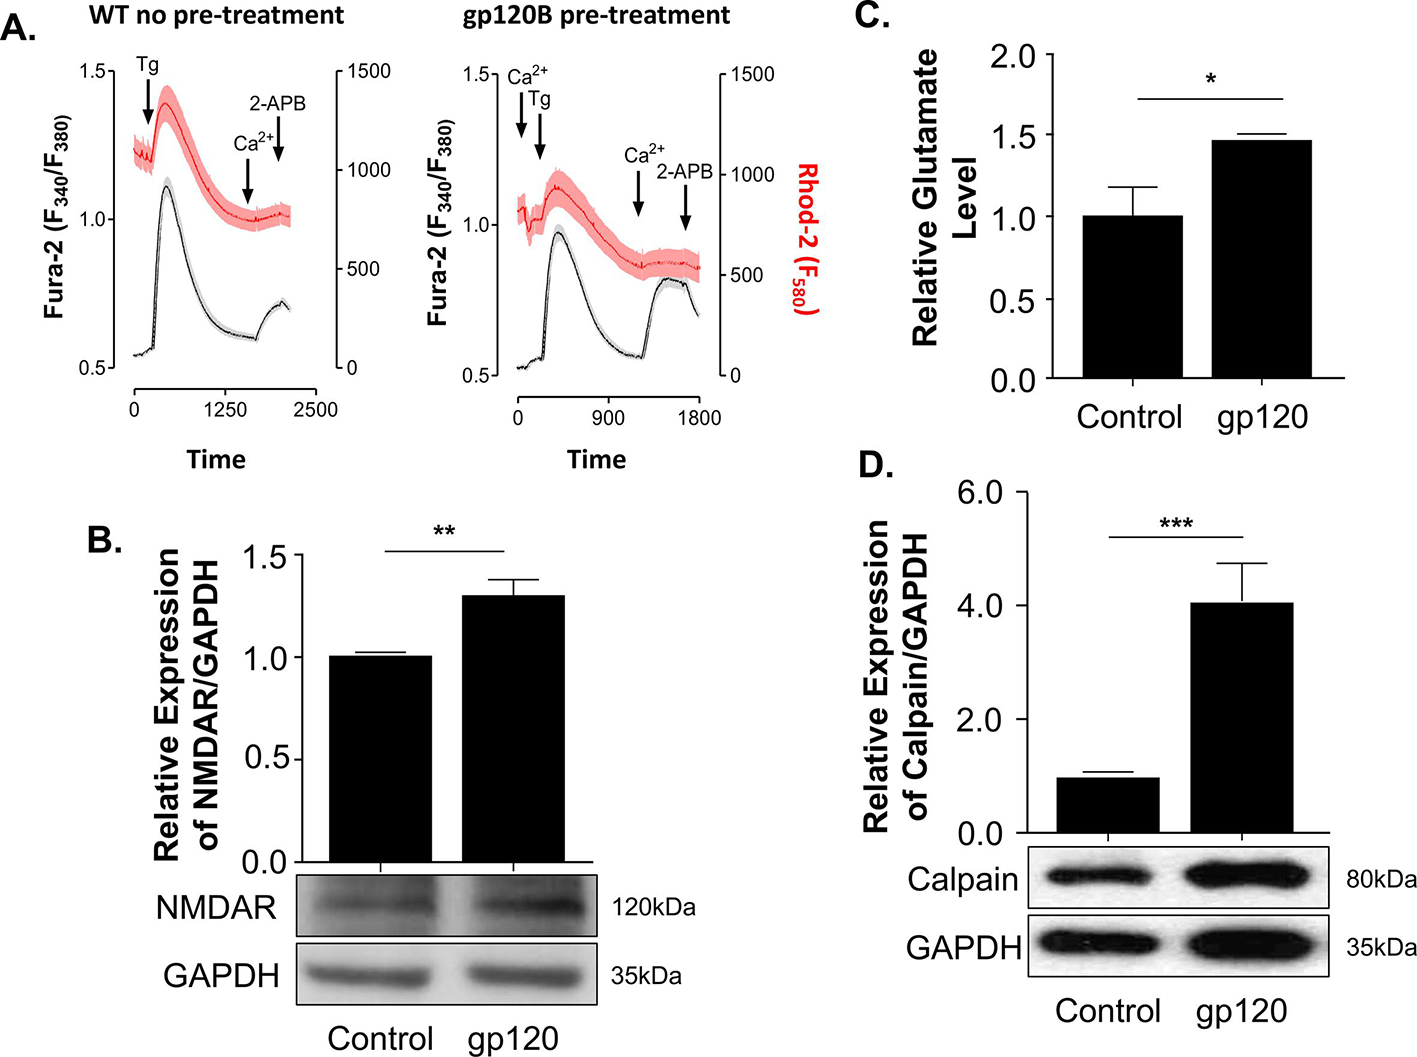
Figure 1. HIV-1 gp120 treatment leads to increased NMDAR expression and glutamate levels.

(A) Cytosolic and mitochondrial Ca2+ levels were measured using a ratiometric dye Fura2-AM (Grey) and Rhodamine (Red) for the cytosolic and mitochondrial Ca2+. Expression levels of NMDAR (B) and Calpain (D) isolated from untreated or gp120-treated SH-SY5Y as obtained by western blot assays, respectively. Quantitative analysis of the western blot was presented along with the bands as a bar graph. The data shown are from a single experiment (n-3) and were statistically significant. GAPDH represents the loading control. (C) Relative glutamate level was measured using a plate reader at O.D. 450 nm for different treatment conditions. The experiments were done in triplicate and the p values were calculated using the Student t-test (mean ± S.D.) (*p<0.05; **p<0.01; ***p<0.001).
