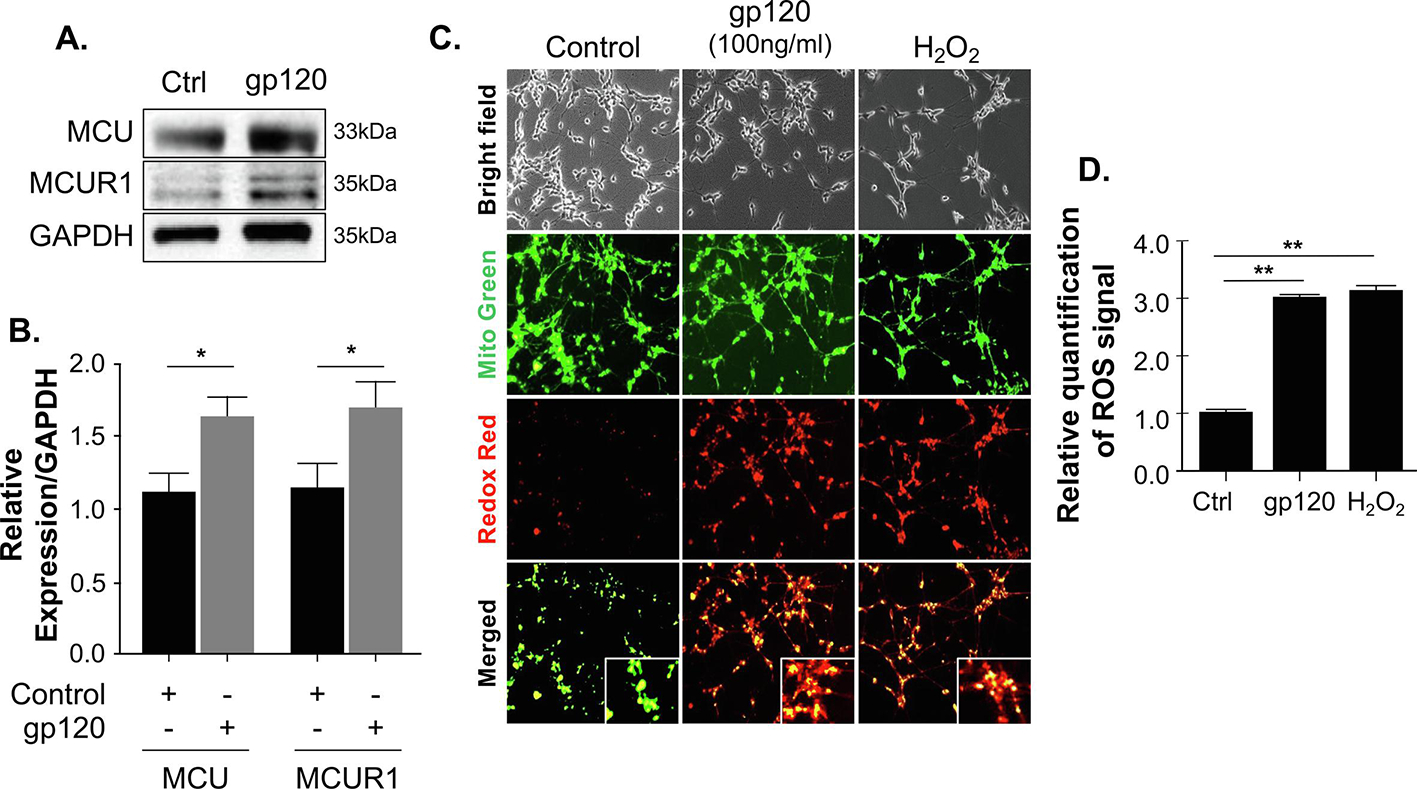
Figure 2. An aberrant expression of MCU proteins in gp120-treated cells.

(A) Expression levels of MCU complex proteins (MCU and MCUR1) isolated from untreated or gp120-treated SH-SY5Y as obtained by western blot assays. GAPDH represents the loading control. (B) Bar graphs represent the quantitative analysis of the western blot. The data shown are from a single experiment (n=3) and were statistically significant. Data represent the mean ± S.D. Results were judged statistically significant if p <0.05 by analysis of variance. (C) Representative images of RedoxSensor (red) and MitoTracker (green) staining for ROS in differentiated SH-SY5Y cells treated with 100ng/ml of gp120 for 24 hours or H2O2. ROS production is seen by the colocalization of the two dyes in the mitochondria. Data shown here are from a single that was replicated 3 times and were statistically significant. (D) Quantification of ROS signal in panel D using the Student t-test. Data were statistically significant (p<0.05) when comparing gp120-treated cells to the control (Ctrl) group (one-way ANOVA).
