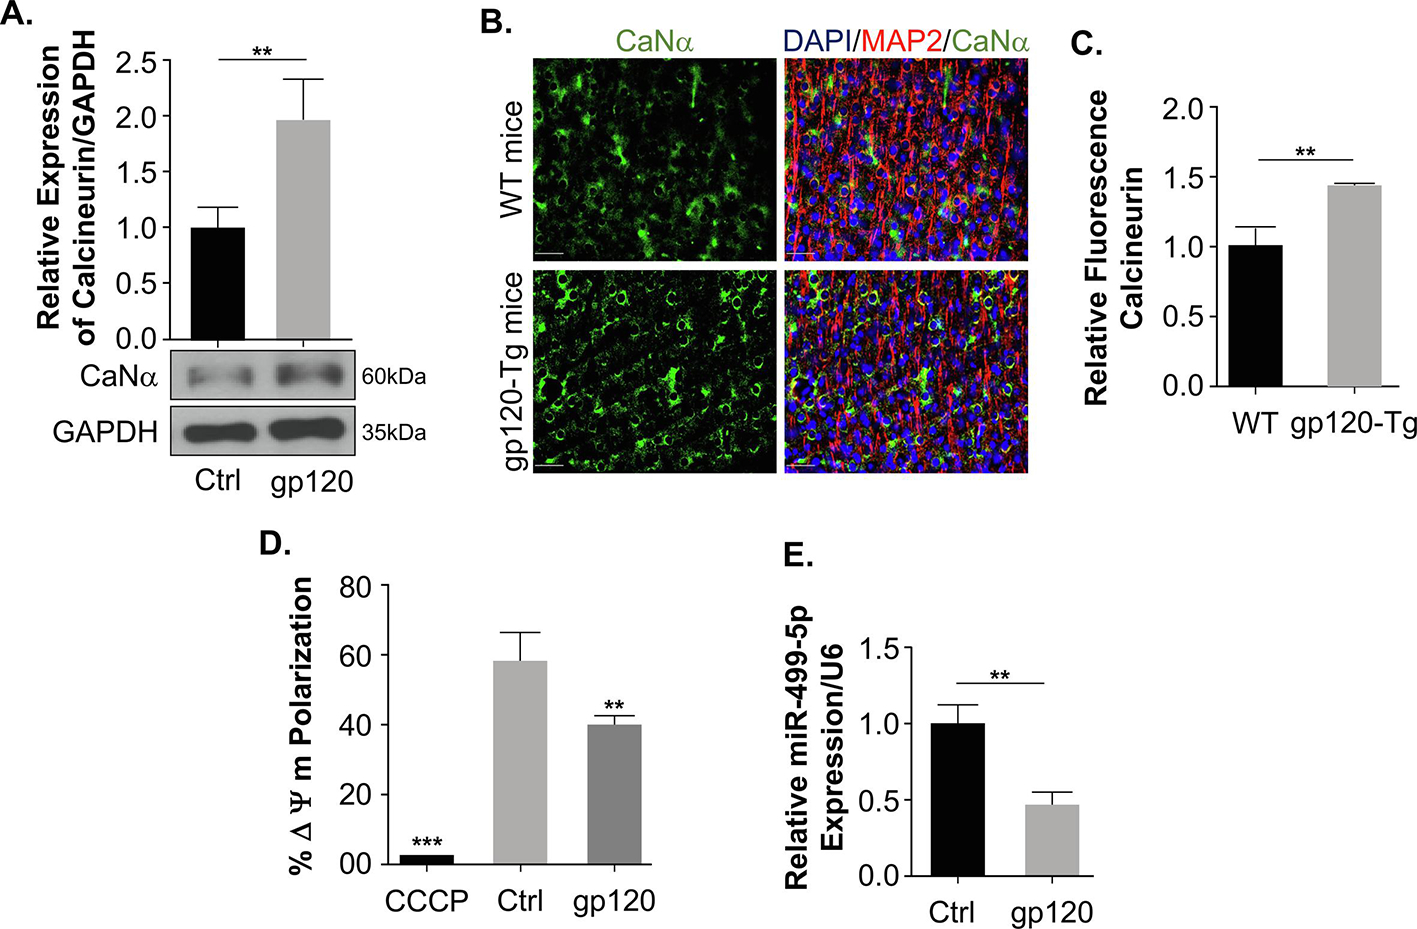
Figure 4. Calcineurin and miR-499-5p expression in the presence of HIV-1 gp120.

(A) The whole cell extract was subjected to the western blot analysis showing the protein expression of Calcineurin in untreated control and gp120 treated for 24 hours. Quantitative analysis of the western blot was presented along with the bands. (B) The immunohistochemistry and the quantitation of the fluorescence of the frontal cerebral cortex layer III (no neighbor deconvolution, scale bar = 40 μm) brain slides of a 9-month-old gp120-Tg mouse (HPX1481) and the age-matched control (HPX1477). Calcineurin – green; MAP-2 – red; and nuclei – blue (DAPI). (C) Quantitative analysis of fluorescent calcineurin was presented as a bar graph. (D) Mitochondrial membrane potential change was measured using JC-1 dye on differentiated SH-SY5Y cells subjected to different treatment conditions using a Guava Flow cytometer. CCCP was used as a control to determine the mitochondrial membrane potential collapse. (E) The relative expression of miR-499-5p normalized to an internal control U6. Data represent the mean ± S.D. Results were judged statistically significant if p<0.05 by analysis of variance. (*p<0.05; **p<0.01; ***p<0.001). (Control=Ctrl).
