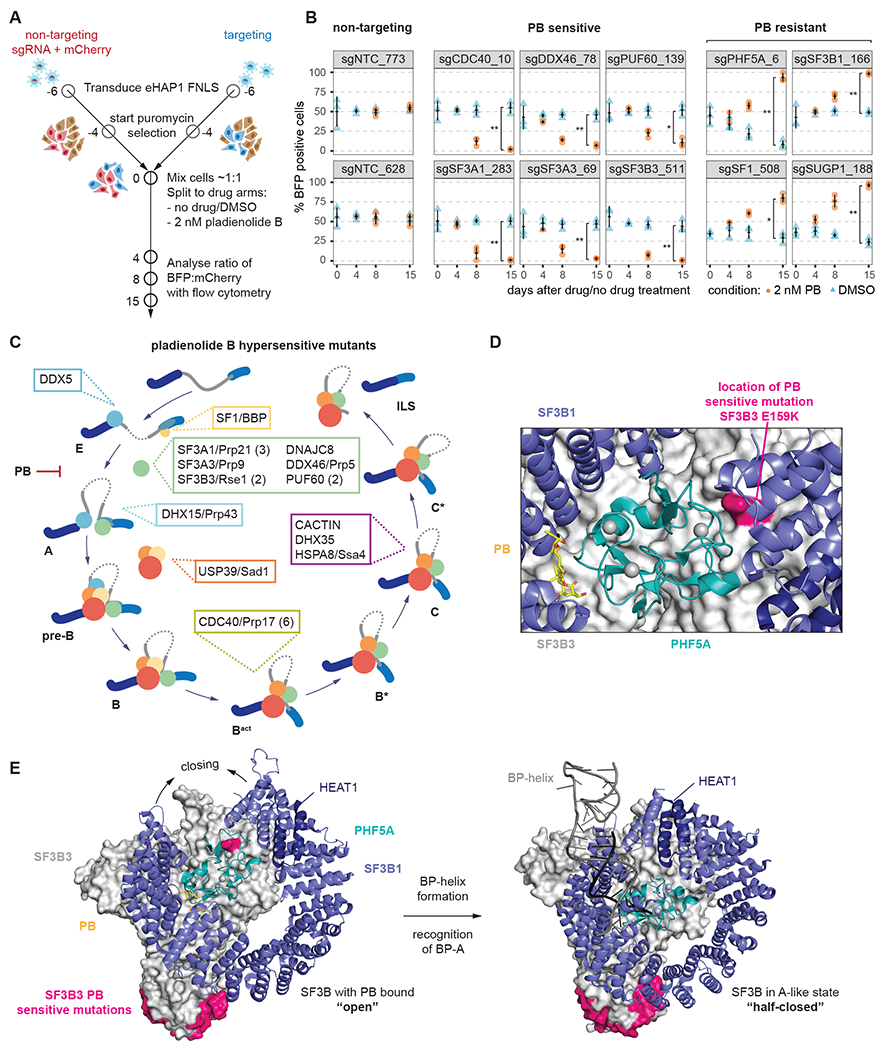
Figure 2. Pladienolide B sensitive mutations occur predominantly in early spliceosomal complexes.

(A) Schematic of the arrayed confirmation assay.
(B) Individual sgRNAs and their performance in the confirmation assay. sgRNAs are grouped by category they were found in in the primary screen. Measurements are from three independent transductions (n=3). *; **; ***: Student’s t-Test (paired) P value < 0.05, 0.01, 0.001, respectively.
(C) Assignment of proteins targeted by sgRNAs conferring hypersensitivity to PB to the spliceosome cycle. If multiple sgRNAs are found for a protein, their number is given in parenthesis.
(D) Close-up of location of PB-sensitive SF3A1 G159K mutation plotted on the structure of SF3b bound to PB. It lies at the interface of SF3B3 (green), SF3B1 (violet) and PHF5A (teal). Zinc ions are shown as grey spheres. (PDB: 6EN4)
(E) Comparison of SF3B3, SF3B1 and PHF5A in the structure of SF3b bound to PB and the Alike complex. Locations of PB-sensitive mutations are marked in magenta and zinc ions are shown as grey spheres. (PDB: 6EN4, 7Q4O)
