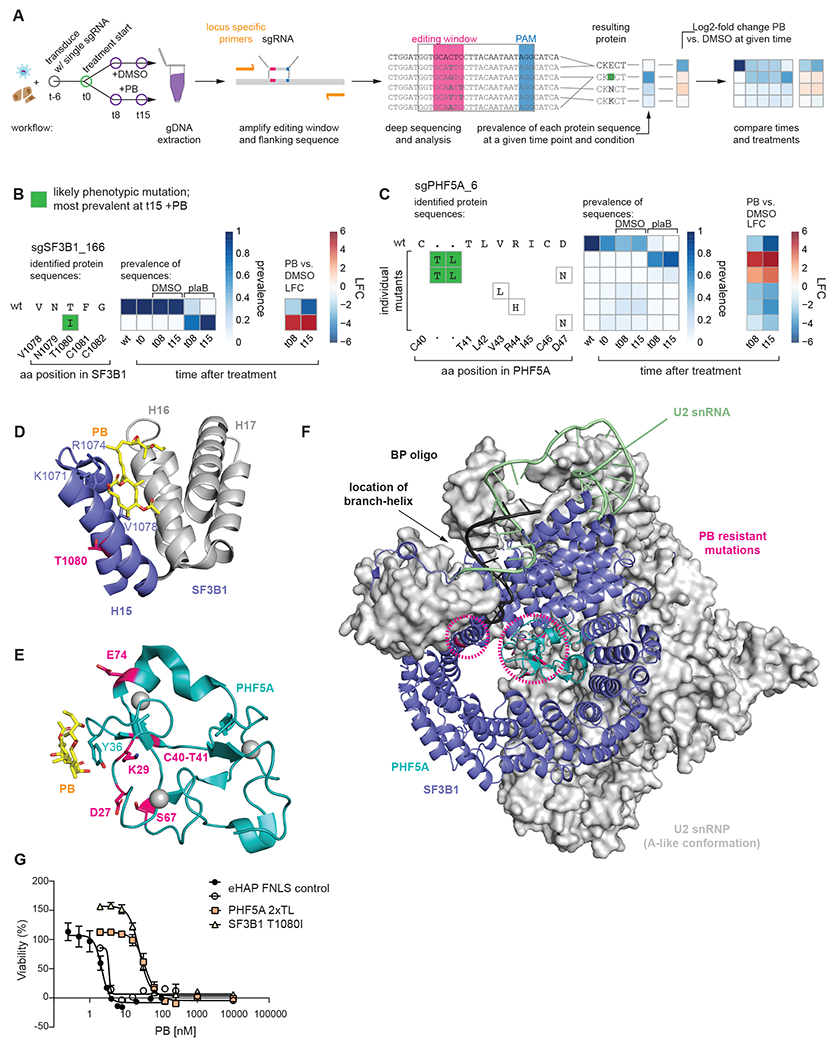
Figure 3. Novel resistance mutations in SF3B.

(A) Schematic of workflow to identify phenotypic mutations. Left: Cells are transduced with single sgRNA in an arrayed format. After six days (t0) treatment is initiated and a cell sample is harvested at t0 as well as t8 and t15 for genomic DNA (gDNA) extraction. Middle: Locus-specific primers are used to amplify the editing window and its flanking sequence of the gDNA. The amplicons are then deep sequenced to identify mutations. Right: Mutational outcomes are translated and the resulting protein sequences are aggregated as multiple DNA sequences may result in the same protein sequence. Prevalence of each protein sequence is calculated for each time point and treatment condition. Where applicable, log2-fold changes are calculated between two samples. Finally, time points and treatments can be compared across samples for both prevalence and/or log2-fold change vs. the wild type (wt). Inferred phenotypic mutations (most prevalent at t15 +PB) are indicated by a green background.
(B) Editing outcome for sgSF3B1_166.
(C) Editing outcome for sgPHF5A_6: In the absence of PB some mutations occur within the editing window around R44. PB treatment enriches for a rare 6 nucleotide insertion occurring from the nicking action of the nCas9, which is part of FNLS.
(D) Location of SF3B1 T1080I resistance mutation. T1080 (magenta) is located on the back of H15 facing away from PB and towards H14 (not shown). Known resistance mutations at K1071, R1074, V1078 are shown. (PDB: 6EN4)
(E) Location of PHF5A resistance mutations: All mutations are indicated (magenta) and occur on the face of PHF5A involved in PB binding. Known PB resistance mutation at Y36C is also indicated. Zinc ions coordinated by PHF5A are shown as grey spheres. (PDB: 6EN4)
(F) Illustration of SF3B1 and PHF5A resistance mutations in context of U2 snRNP (A-like conformation). Mutations (magenta, circled) occur in vicinity to the branch helix and branchpoint adenosine. Zinc ions are shown as grey spheres. (PDB: 7Q4O)
(G) Sixty-hour cell proliferation profiling (CellTiter-AQueous cellular viability and cytotoxicity assay) of control eHAP FNLS cell line expressing non-targeting sgRNA and monoclonal cell lines carrying either SF3B1 T1080I or PHF5A 2xTL mutation to PB. Error bars indicate s.d. n = 3 (average of two technical replicates for independent clonal cell lines).
