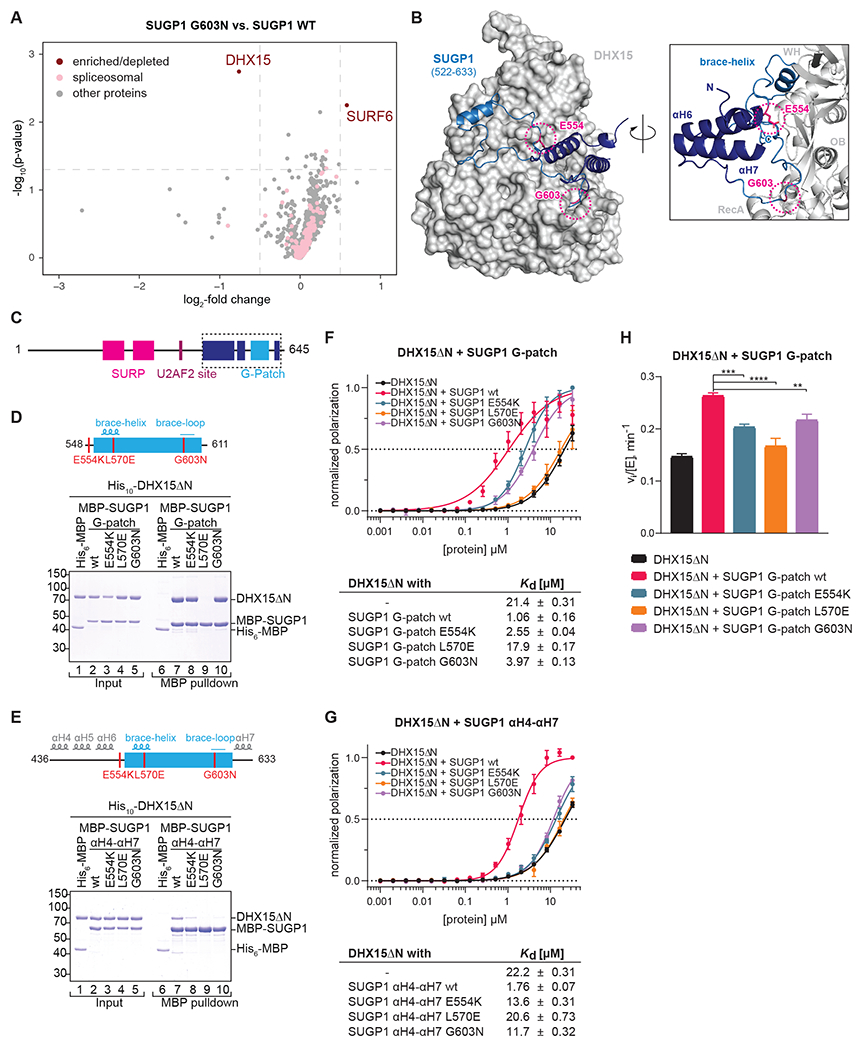
Figure 6. SUGP1 interacts with DHX15.

(A) miniTurbo proximity labeling using FLAG-SUGP1-miniTurboID G603N vs. wt overexpressed in HEK293T cells. Enriched biotinylated proteins were identified with TMT-MS. −log10(p-value) is plotted against the log2-fold change (LFC) in a volcano plot (dashed lines: cutoffs at p < 0.05 and LFC > 0.5).
(B) AlphaFold2 prediction of SUGP1 (522-633), encompassing the G-patch motif flanked by αH6 and αH7, in complex with DHX15.
(C-E) Domain organization and schematic representation of the MBP-hsSUGP1 variants with the introduced mutations colored in red.
(D-E) Coomassie-stained gels of protein binding assays using purified MBP-hsSUGP1 constructs and His10-hsDHX15ΔN. MBP-SUGP1 G-patch (D), and αH4-αH7 (E) with either wildtype (wt) protein sequence or carrying the indicated mutation were used as baits and His6-MBP served as a control. Input (1.5% of total) and eluates (24% of total) were loaded.
(F-G) Fluorescence polarization of FAM-labeled U12 RNA with His10-hsDHX15ΔN in the absence or presence of MBP-SUGP1 G-patch (F) and αH4-αH7 (G) wt or mutants. Dashed line indicates 50% normalized polarization. Error bars represent standard deviations from the average of triplicate measurements. RNA dissociation constants (Kd) with standard error of means (SEM) were derived from linear regression.
(H) Initial ATPase activity rates of His10-hsDHX15ΔN in the absence or presence of MBP-hsSUGP1 G-patch wt or mutants at 250 μM ATP. Error bars indicate standard deviations of three independent measurements, asterisks denote significance (one-way ANOVA with Tukey’s) with ** p < 0.01, *** p < 0.001, and **** p < 0.0001.
