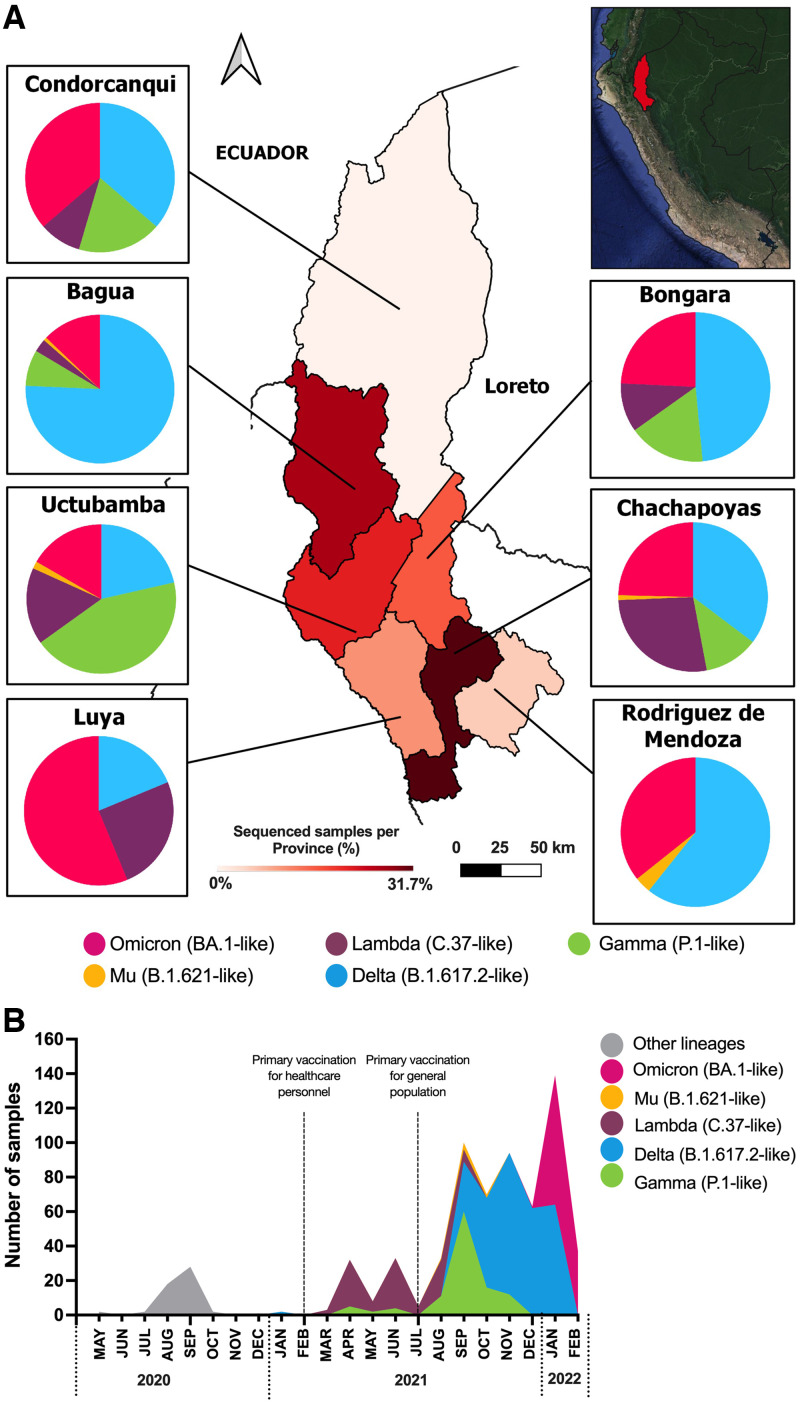
Figure 1.
(A) Heat map of the samples sequenced in the seven provinces of Amazonas. The pie charts represent the distribution of variants. Variants are represented in pink (Omicron), yellow (Mu), purple (Lambda), blue (Delta) and green (Gamma). The red gradient represents the percentage of sequenced samples per province. (B) Prevalence of SARS-CoV-2 variants in Amazonas through time. Vaccination of health workers started in February 2021; in July 2021, vaccination started for the rest of the population, according to age.

