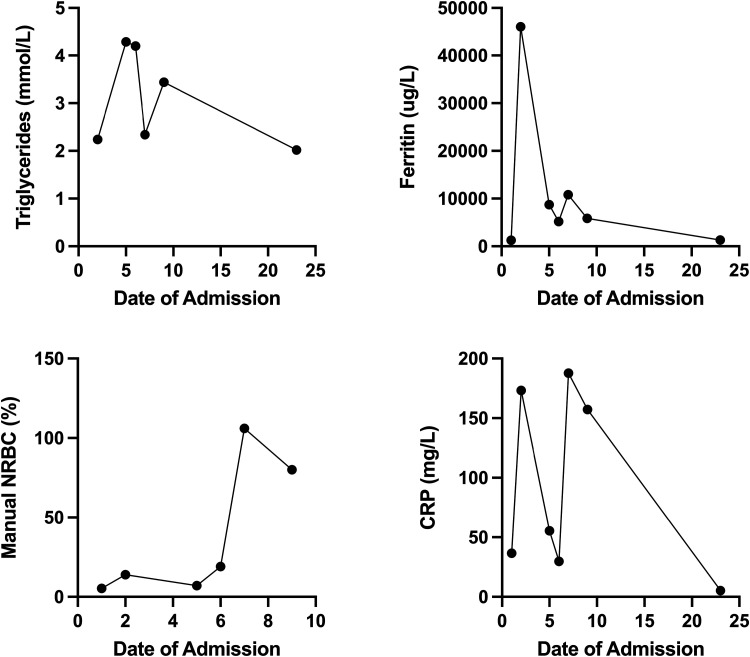
Figure 2.
The patient’s day of admission (DOA) is plotted on the x-axis, and markers of bone marrow necrosis (BMN)/inflammation are plotted on the y-axis. The corresponding units are denoted in the y-axis of each panel. Manual nucleated red blood cells were not calculated after DOA 10. The line graph shows the trend of BMN/inflammatory markers throughout the patient’s course of disease.

