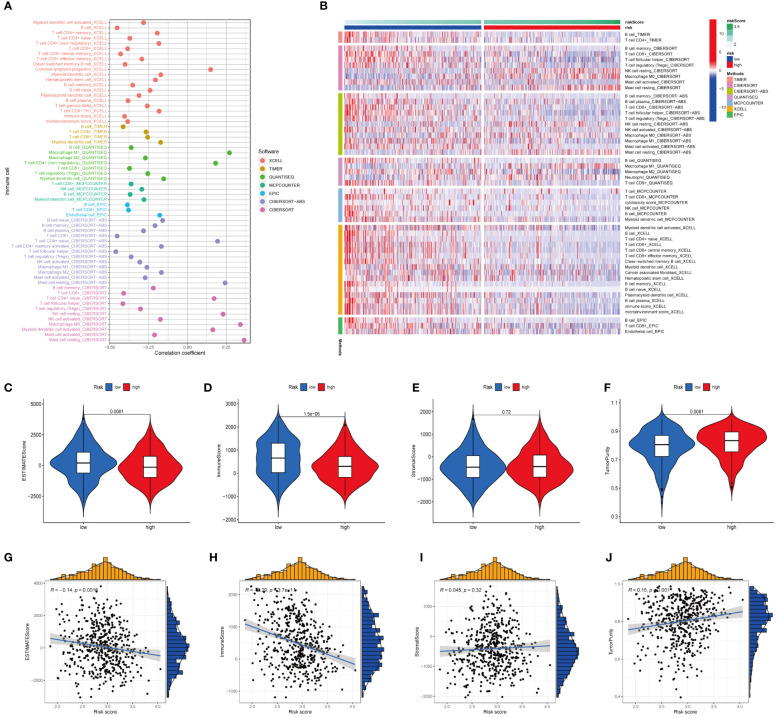
Figure 11.
Analysis of immune landscape between the high-risk and low-risk groups in the TCGA dataset. (A) Association of risk scores with immune microenvironment as shown by Spearman correlation analysis. (B) Differences in immune cell abundance between the high-risk and low-risk groups. (C) Differences in ESTIMATE scores between the two groups. (D) Differences in immune score between the two groups. (E) Differences in stromal score between the two groups. (F) Differences in tumor purity between the two groups. (G) Risk scores were negatively correlated with ESTIMATE scores. (H) Risk scores were negatively correlated with immune score. (I) Risk score was positively correlated with stromal score. (J) Risk score was positively correlated with tumor purity.

