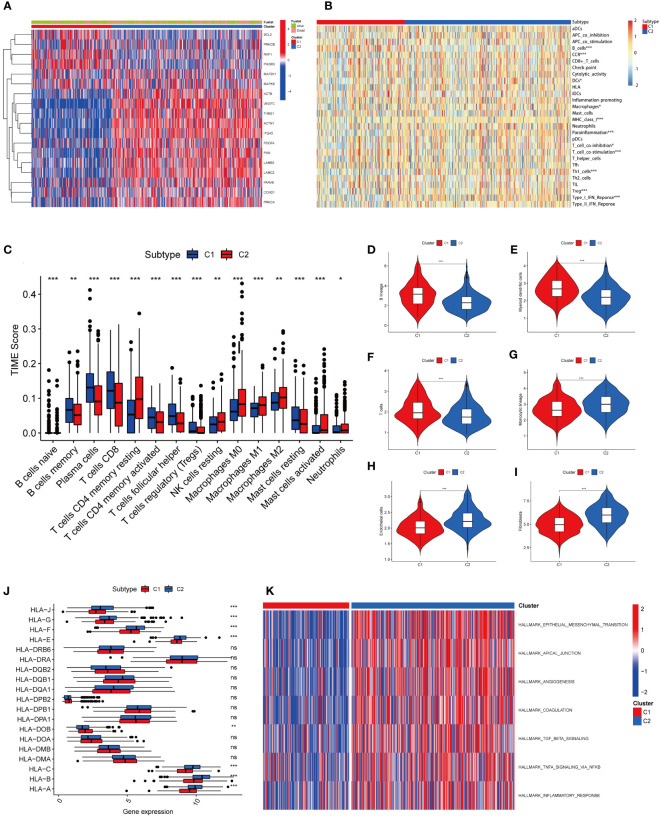
Figure 3.
Heatmap results and immune infiltration analysis of two tumor subtypes. (A) The heatmap showed differences in prognostic gene expression between the two tumor subtypes. The difference was significantly correlated with survival or death status. (B) Heatmap showed different levels of immune cell expression in two tumor subtypes. (C) Abundance of 15 infiltrating immune cell types in two HNSCC subtypes. (D) Comparison of B lineage cells in two tumor subtypes. (E) Comparison of myeloid dendritic cells in two tumor subtypes. (F) Comparison of T cells in two tumor subtypes. (G) Comparison of monocytic lineage cells in two tumor subtypes. (H) Comparison of endothelial cells in two tumor subtypes. (I) Comparison of fibroblasts cells in two tumor subtypes. (J) The differences in HLA expression between the two tumor subtypes suggest that different tumor subtypes have different levels of ability to activate immune cells. (K) GSVA-based analysis of expression differences of pathways in two tumor clusters. (*represents P<0.05, **represents P<0.01, ***represents P<0.001; "ns" represents not significant. )

