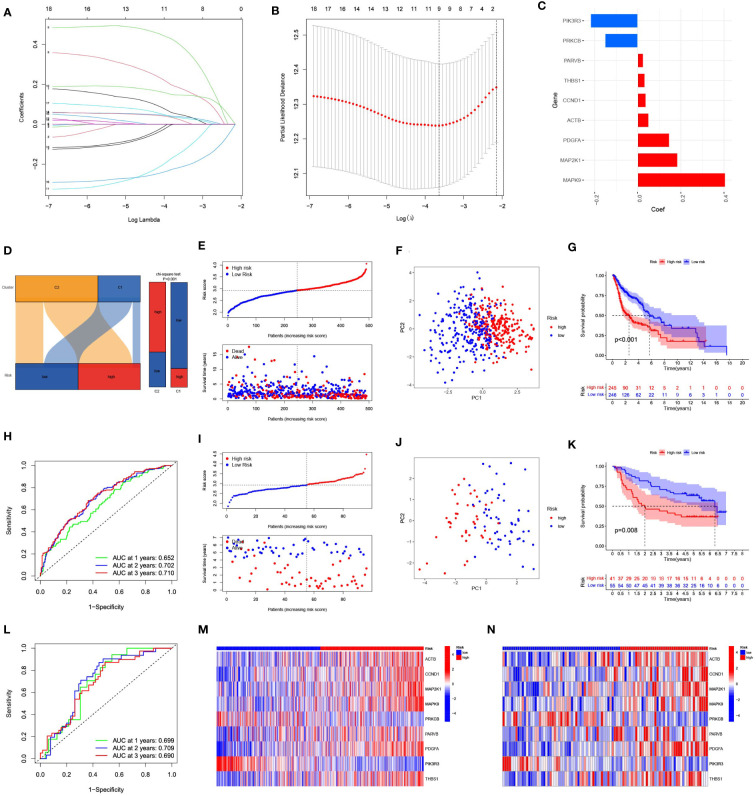
Figure 4.
Construction and evaluation of a prognostic model based on 9 focal adhesion-related genes. (A) The LASSO coefficient profiles of 9 focal adhesion-related genes. (B) Tuning parameter (λ) selection cross validation error curve, the optimal log λ value is the left dotted line in the plot. (C) Construction of prognostic risk signature based on 9 genes. (D) The Sankey diagram on the left intuitively shows the relationship between tumor subtypes and risk groups. The bar chart on the right side shows the difference in the risk group composition of tumor subtypes calculated by chi-square test. (E) The distribution of risk score、survival time and OS status in TCGA. (F) The PCA results showed significant differences between the high-risk and low-risk groups. (G) The prognosis and survival time were significantly lower in the high-risk group than in the low-risk group. (H) ROC curve analysis of the 9 focal adhesion-related genes signature of the 1, 3, and 5 years in the TCGA. (I–L) Similar results were obtained using the same method in the GSE41613 dataset. (M, N) The heatmap shows that this has nine genes with significant differences in expression between the high and low risk groups in the TCGA (M) and GSE41613 (N) datasets.

