Figure 7.
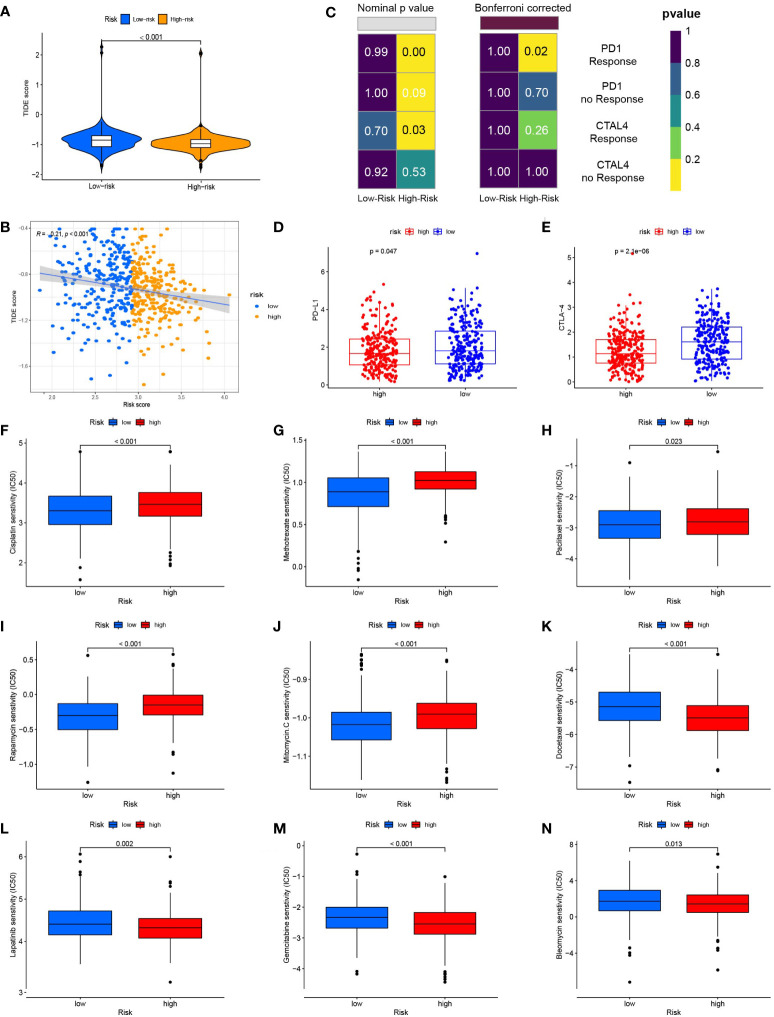
Risk score predicts responses to immunotherapy and chemotherapy. (A) TIDE scores were significantly lower in the high-risk group than in the low-risk group. (B) Risk scores were negatively correlated with TIDE scores. (C) Using the SubMAP algorithm, we inferred the possibility of anti-programmed cell death protein 1(PD1) and anti- cytotoxic T-lymphocyte-associated protein 4 (CTLA4) response immunotherapy in the high and low risk groups. High risk group may respond better to PD-1 treatment (Bonferroni-corrected P = 0.02). (D) The expression level of PD-L1 in the high and low risk groups (E) The expression level of CTLA-4 in high and low risk groups. (F) The box plot of the estimated IC50 for cisplatin. (G) The box plot of the estimated IC50 for methotrexate. (H) The box plot of the estimated IC50 for paclitaxel. (I) The box plot of the estimated IC50 for rapamycin. (J) The box plot of the estimated IC50 for mitomycin. C (K) The box plot of the estimated IC50 for docetaxel. (L) The box plot of the estimated IC50 for lapatinib. (M) The box plot of the estimated IC50 for gemcitabine. (N) The box plot of the estimated IC50 for bleomycin.

