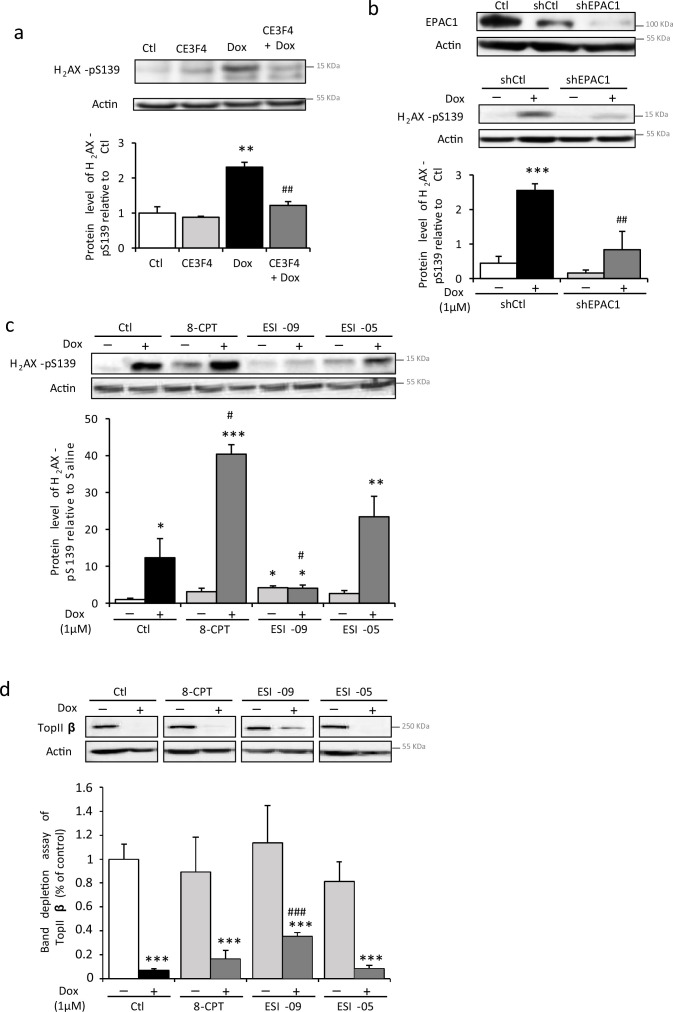
Figure 3. Pharmacological inhibition of EPAC1, but not EPAC2, protects cardiomyocytes from doxorubicin (Dox)-induced DNA damage.
(a) Neonatal rat ventricular myocyte (NRVM) were untreated or treated with Dox (1 µM) ± the specific EPAC1 inhibitor CE3F4 (10 µM) for 16 hr and the level of the DNA damage marker H2AX-pS139 was analyzed by western blot. Actin was used as a loading control. Protein levels relative to Ctl are presented in bar graphs (mean ± SEM, n=3–5). **p<0.01 vs. control, ##p<0.01 vs. Dox alone. (b) NRVM were transfected with control (shCtl) or EPAC1 (shEPAC1) shRNA for 12 hr before treatment with Dox for 16 hr. The relative levels of EPAC1 and H2AX-pS139 were measured by immunoblotting with actin as a loading control (mean ± SEM, n=3–5). ***p<0.001 vs. shCtl, ##p<0.01 vs. shCtl + Dox. (c, d) NRVM were untreated or treated with Dox (1 µM) and either the EPAC activator 8-CPT (10 µM) or the EPAC1 inhibitor ESI-09 (1 µM) or the EPAC2 inhibitor ESI-05 (1 µM) for 24 hr. (c) The level of the DNA damage marker H2AX-pS139 was analyzed by western blot. Actin was used as a loading control. Protein levels relative to Ctl are presented in bar graphs (mean ± SEM, n=3). *p<0.05, **p<0.01, ***p<0.001 vs. control, #p<0.05 vs. Dox alone. (d) The level of free topoisomerase IIβ (TopIIβ) was quantified by band depletion assay. Actin was used as a loading control. Protein levels relative to Ctl are presented in bar graphs (mean ± SEM, n=3–5). ***p<0.001 vs. control, ###p<0.001 vs. Dox alone.

