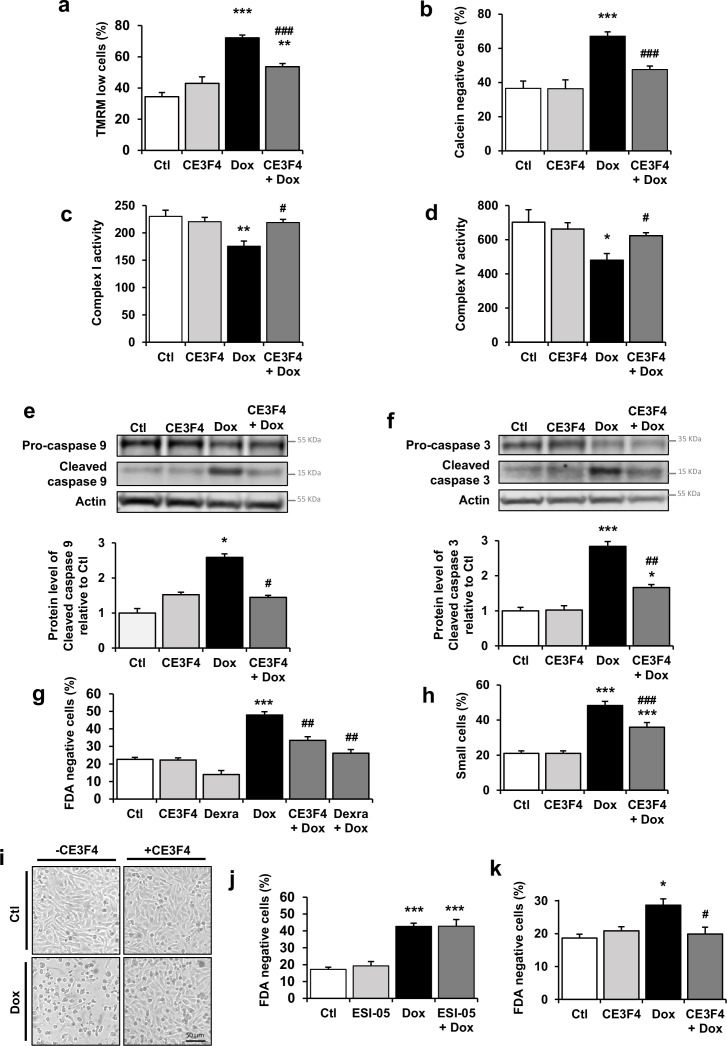
Figure 4. EPAC1 inhibition reduces doxorubicin (Dox)-induced mitochondrial apoptotic pathway.
(a, b) Neonatal rat ventricular myocyte (NRVM) were untreated or treated with Dox (1 µM) ± CE3F4 (10 µM) for 24 hr and analyzed by flow cytometry. Results are expressed as means ± SEM. **p<0.01, ***p<0.001 vs. control, ###p<0.001 vs. Dox alone. (a) TMRM staining was used to assess the percentage of cells with decreased ΔΨm (as TMRM low cells) (n=10). (b) Calcein-cobalt assay was used to record MPTP opening (as calcein negative cells) (n=3–4). (c, d) NRVM were untreated or treated with Dox (1 µM) ± CE3F4 (10 µM) for 16 hr. Activity of the mitochondrial respiratory complex I (n=4) (c) and complex IV (n=3) (d) is presented in the bar graphs as means ± SEM. *p<0.05, **p<0.01 vs. control, #p<0.05 vs. Dox alone. (e, f) NRVM were untreated or treated with Dox (1 µM) ± CE3F4 (10 µM) for 6 hr and the levels of cleaved-caspase 9 (e) and cleaved-caspase 3 (f) were detected by western blot. Actin was used as a loading control and protein levels relative to Ctl are presented in bar graphs (means ± SEM, n=3 for caspase 9 and n=7–11 for caspase 3). *p<0.05, ***p<0.001 vs. control, #p<0.05, ##p<0.01 vs. Dox alone. (g, h) NRVM were treated or not with Dox (1 µM) ± CE3F4 (10 µM) ± dexrazoxane (200 µM) for 24 hr and analyzed by flow cytometry. Results in bar graphs are expressed as mean ± SEM. ***p<0.001 vs. control, ##p<0.01, ###p<0.001 vs. Dox alone. (g) Percentage of dead cells (FDA negative cells) (n=3–7). (h) Percentage of small cells (n=8). (i) Representative micrographs of NRVM untreated or treated with Dox (1 µM) ± CE3F4 (10 µM) for 24 hr. (j) The percentage of dead cells (FDA negative cells) was assessed in NRVM left untreated or treated with Dox (1 µM) ± the specific EPAC2 inhibitor ESI-05 (1 µM) and presented as means ± SEM (n=5). ***p<0.001 vs. control, ###p<0.001 vs. Dox alone. (k) Freshly isolated adult rat ventricular myocytes (ARVM) were treated or not with Dox (1 µM) ± CE3F4 (10 µM) for 24 hr and cell death was determined. The percentage of dead cells (FDA negative cells) is presented in bar graphs (means ± SEM, n=4–5). *p<0.05 vs. control, #p<0.05 vs. Dox alone.

