Figure 3.
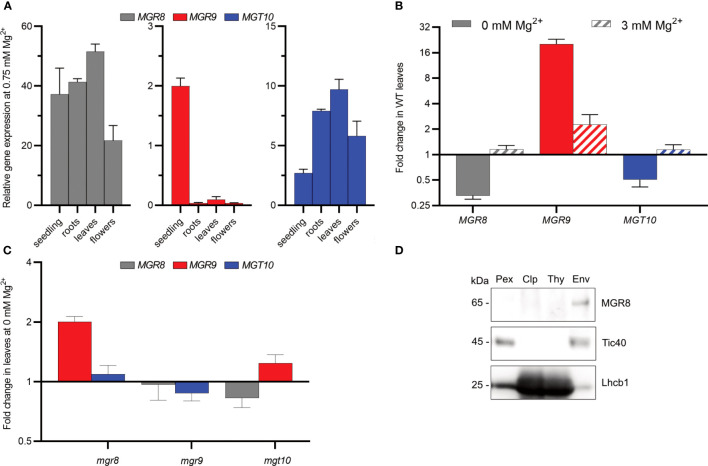
Expression pattern and chloroplast localization in Arabidopsis. (A) Relative expression in 2-week-old seedlings and roots, leaves, and flowers of 6-week-old wild type plants grown hydroponically at 0.75 mM Mg2+ was determined using quantitative RT-PCR. ACTIN8 and PEX4 were used as internal standards. (B, C) Wild type (WT) plants (B) and mutants (C) were grown first for two weeks at 0.75 mM Mg2+ and then for three to four weeks at either 0 or 3 mM Mg2+. The plotted data represent expression fold change relative to the expression at 0.75 mM Mg2+ in the same genotype. Where two independent lines were available, the obtained data are presented as averages. The scale on the Y-axis in (B, C) is log2, whereas the fold change values are non-log2-transformed. The data presented in (A–C) are means ± S.E.M (n = 4 plants). (D) Total protein extracts (Pex), Chloroplasts (Clp), thylakoid (Thy), and envelope (Env) membranes were prepared from wild type leaves. Localization of MGR8 in chloroplast and subfractions was performed by immunoblotting with an MGR8-peptide-specific antibody. Purity of fractions was confirmed using antibodies against marker proteins for the respective compartment: inner envelope translocon complex Tic40 protein and the light harvesting Chl a/b binding thylakoid protein Lhcb1. Uncropped version of the immunoblots is shown in Supplementary Figure S8 .

