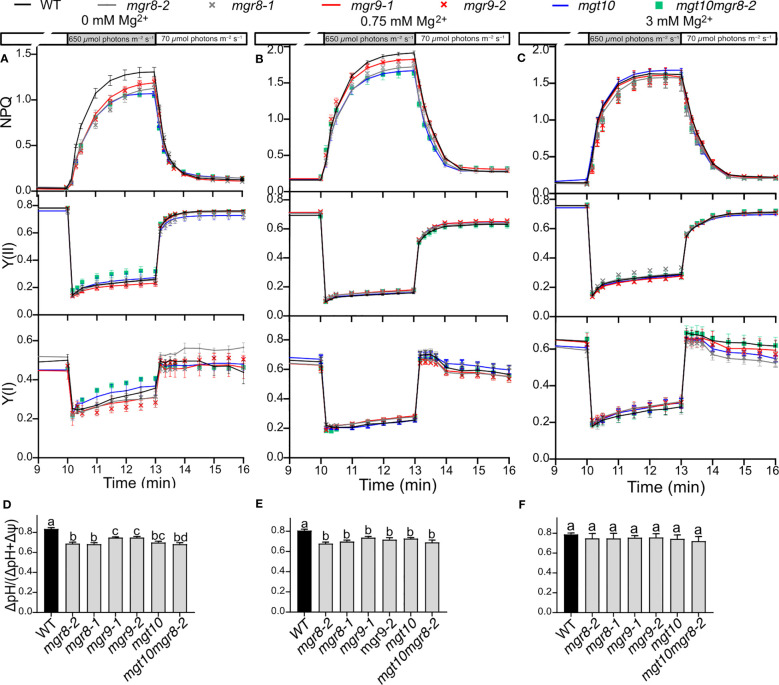
Figure 5.
Dynamics of photosynthesis and photoprotection in fluctuating light. Wild type (WT) plants and mutants were grown hydroponically first for two weeks at 0.75 mM Mg2+ and then for four to five weeks at the indicated Mg2+ concentrations. Plants were dark adapted for 20 min, illuminated for 10 min with low light, then for 3 min with high light, and then again for 3 min in low light. Chl fluorescence and electrochromic shift were recorded with Dual-PAM-100. The plots in (A–C) show non-photochemical quenching (NPQ), PSII, and PSI quantum yields (Y(II) and (YI)). The plots in (D–F) show the partitioning of the proton motive force to ΔpH as determined from ECS measurements at the end of transition from low to high light. The plotted data are means ± S.E.M. (n = 4-7 plants). Different letters indicate statistically significant differences among the genotypes according to Tukey one-way ANOVA (P < 0.05).

