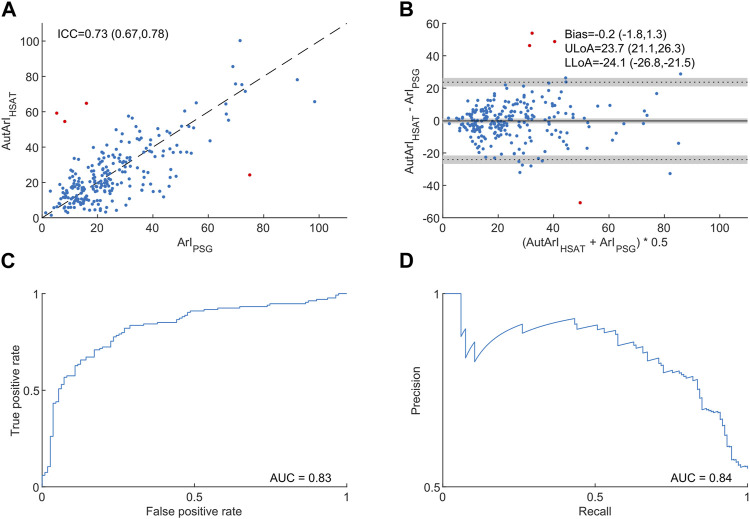
FIGURE 2.
Comparison of the autonomic arousal index derived from home sleep apnea tests to the arousal index from polysomnography. Panel (A) shows a scatter plot to compare the autonomic arousal index (AutArIHSAT) to the cortical arousal index (ArIPSG) and the intraclass correlation coefficient of absolute agreement with a 95% confidence interval in brackets. Panel (B) illustrates differences between the AutArIHSAT and the ArIPSG in a Bland-Altman plot and provides bias and levels of agreement together with their respective 95% confidence intervals in brackets. Panel (C) shows the autonomic arousal index’s receiver operating characteristic (ROC) curve and the area under the curve for detecting an arousal index ≥20. Panel (D) shows the autonomic arousal index’s precision-recall curve and the area und the curve for detection an arousal index ≥20. We identified four outliers and highlighted them in red (see the discussion section for information about the outliers).

