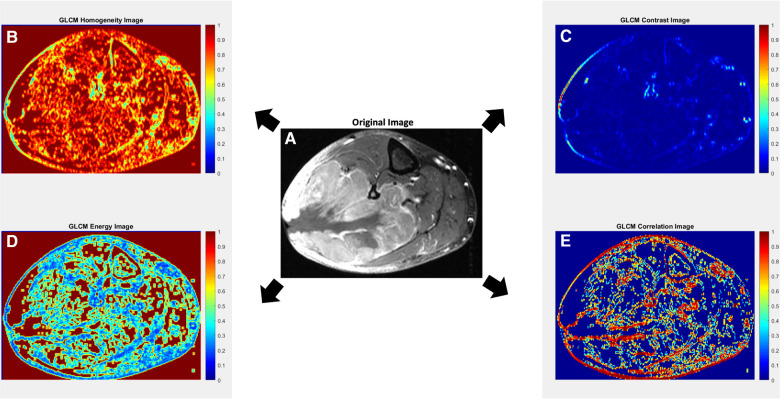
Figure 2.
Axial contrast-enhanced T1-weighted MR image with fat suppression of a 70-year-old male with leiomyosarcoma of the posterolateral calf (A), with corresponding texture parameter maps for Gray-Level Co-Occurrence Matrix (GLCM) homogeneity (B), GLCM contrast (C), GLCM energy (D) and GLCM correlation (E). The GLCM homogeneity map (B) reflects the closeness of the distribution of elements in the GLCM map relative to the GLCM diagonal. Highly homogenous regions (i.e., regions with less variation; close to the GLCM diagonal) receive a value of 1, while highly heterogenous regions receive a value of 0. The GLCM contrast map (C) measures the intensity contrast between an index pixel and its neighborhood pixels. Regions of high contrast show high heterogeneity in values up to a maximum value of 1. A constant image receives a value of 0. In some studies, contrast may also be referred to as variance and inertia. The GLCM energy map (D) measures the sum of the squared elements in the GLCM, whereby highly homogenous regions receive values of 1 and highly heterogenous regions receive values of 0. In some studies, energy may also be referred to as angular second moment, uniformity, or uniformity of energy. The GLCM correlation map (E) reflects how correlated a given pixel is to its neighboring pixels, with highly correlated regions receiving values of 1. In general, a neighborhood of 3 × 3 was adopted for the GLCM approach. Original image (A) courtesy of The Cancer Genome Atlas Sarcoma Collection (TCGA-SARC) based on data generated by the TCGA research network: http://cancergenome.nih.gov/ (38, 39).

