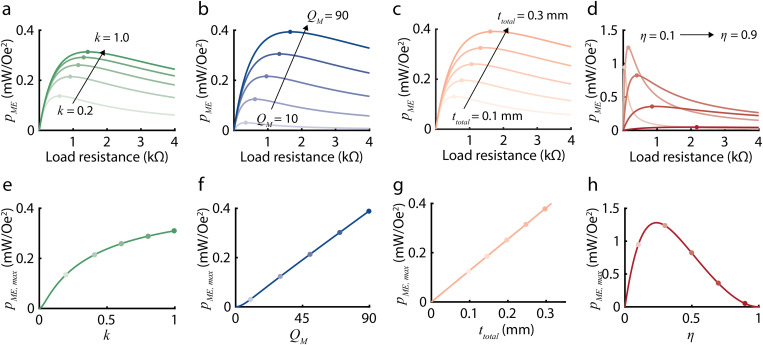
FIG. 3.
Plots show how the ME power coefficient depends on several experimentally controlled variables based on our theoretical model. Panels (a)–(d) show as a function of load resistance for varying (a) k, (b) , (c) , and (d) . Increasing k from 0.2 to 1.0, from 10 to 90, and from 0.1 to 0.3 mm, and from 0.1 to 0.9 increases the optimal load . Panel (e)–(h) shows the maximum ME power coefficient , which can be calculated from Eq. (6), as a function of (e) k, (f) , (g) , and (h) . is linearly related to and and non-linearly related to k and . increases with increasing , , and k and is maximized at an optimal .

