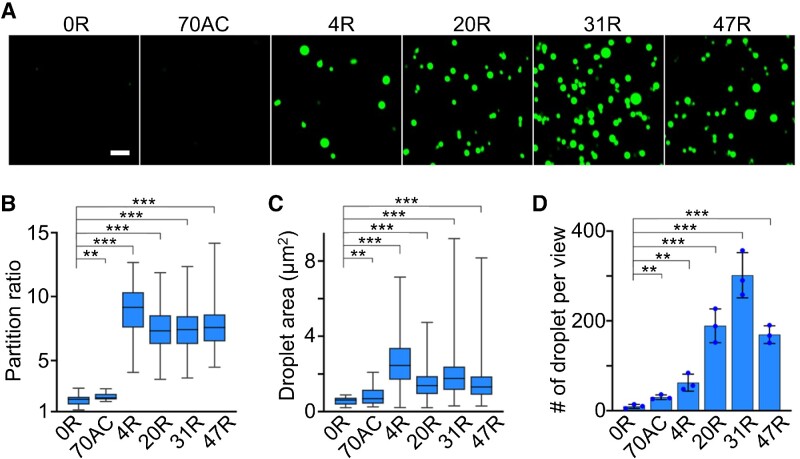
Figure 1.
CAG-repeat-regulated in vitro RNA condensation. (A) Confocal fluorescence imaging of RNA condensates induced by F30-2d×Broccoli-tagged 4×, 20×, 31× or 47× CAG repeats (4R, 20R, 31R or 47R). F30-2d×Broccoli (0R) and F30-2d×Broccoli-tagged 70 repeats of AC (70AC) were used as the negative control. Fluorescence images were taken in solutions containing 4 μM RNA, 20 mM MgCl2 and 80 μM DFHBI-1T after annealing. Scale bar, 5 μm. (B) The partition ratio, i.e. the ratio of average fluorescence intensity inside individual condensate versus background solution signals, and (C) the droplet area of each type of RNA condensate is plotted in a box with minimum to maximum whiskers. The top and bottom line, upper and lower box boundary and inner line indicate the minimum and maximum data point excluding outliers, 75th and 25th percentile and median of the data, respectively. A total of 20, 29, 241, 318, 323 and 437 condensates were analyzed in the case of 0R, 70AC, 4R, 20R, 31R and 47R, respectively. (D) The number of droplets observed per imaging view. Each imaging view equals 4430 μm2. Shown are the mean and the standard deviation (SD) values from at least three representative images. Two-tailed Student's t-test: ***P< 0.001; **P< 0.01.

