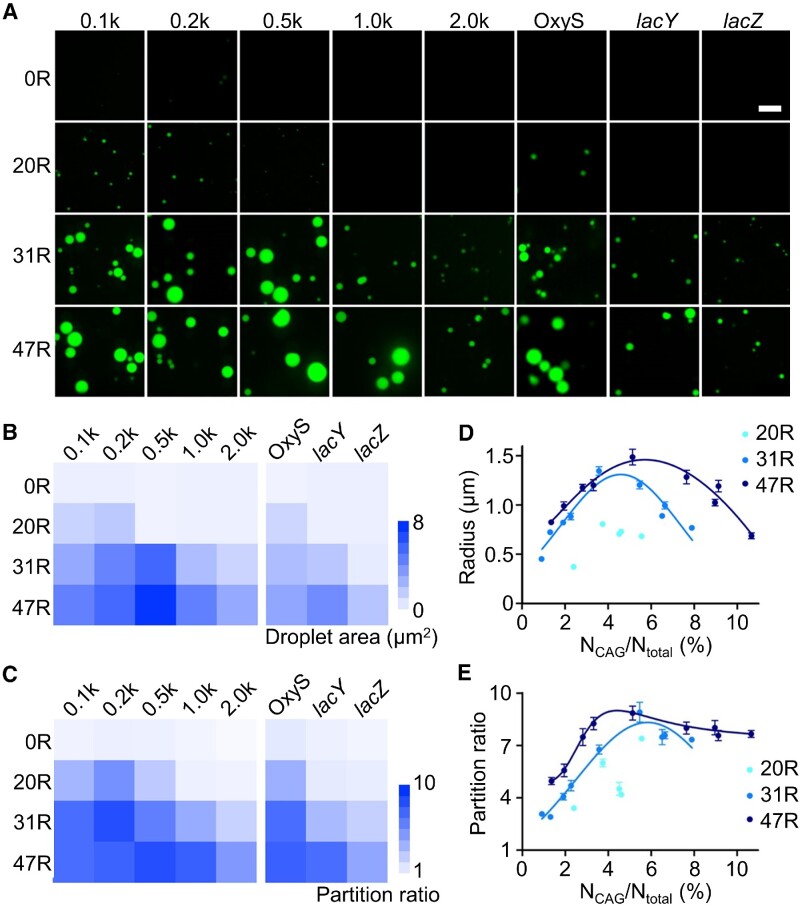
Figure 2.
Targeted RNA condensation via CAG repeats. (A) Confocal fluorescence imaging of F30-2d×Broccoli-0×, 20×, 31× or 47× CAG repeats (0R, 20R, 31R, 47R)-tagged 100, 200, 500, 1000 or 2000 nt long scrambled RNA (0.1k, 0.2k, 0.5k, 1.0k and 2.0k), or OxyS (109 nt), lacY (1254 nt) and lacZ (3044 nt) RNA sequences. Fluorescence images were taken in solutions containing 4 μM RNA, 20 mM MgCl2 and 80 μM DFHBI-1T after annealing. Scale bar, 5 μm. (B) The mean droplet area and (C) partition ratio of individual condensates is plotted based on data shown in Supplementary Figures S5 and S6. (D) The radius and (E) partition ratio of each studied condensate is plotted as a function of the ratio between the number of CAG repeats and total RNA length. Results from each 20×, 31× or 47× CAG-tagged target RNA, including F30-2d×Broccoli, 0.1k, 0.2k, 0.5k, 1.0k and 2.0k scrambled RNAs, and OxyS, lacY and lacZ are gathered and denoted under 20R (cyan), 31R (light blue) and 47R (dark blue), respectively. Shown are the mean and the standard error of the mean (SEM) values from at least three replicated measurements for each data point.

