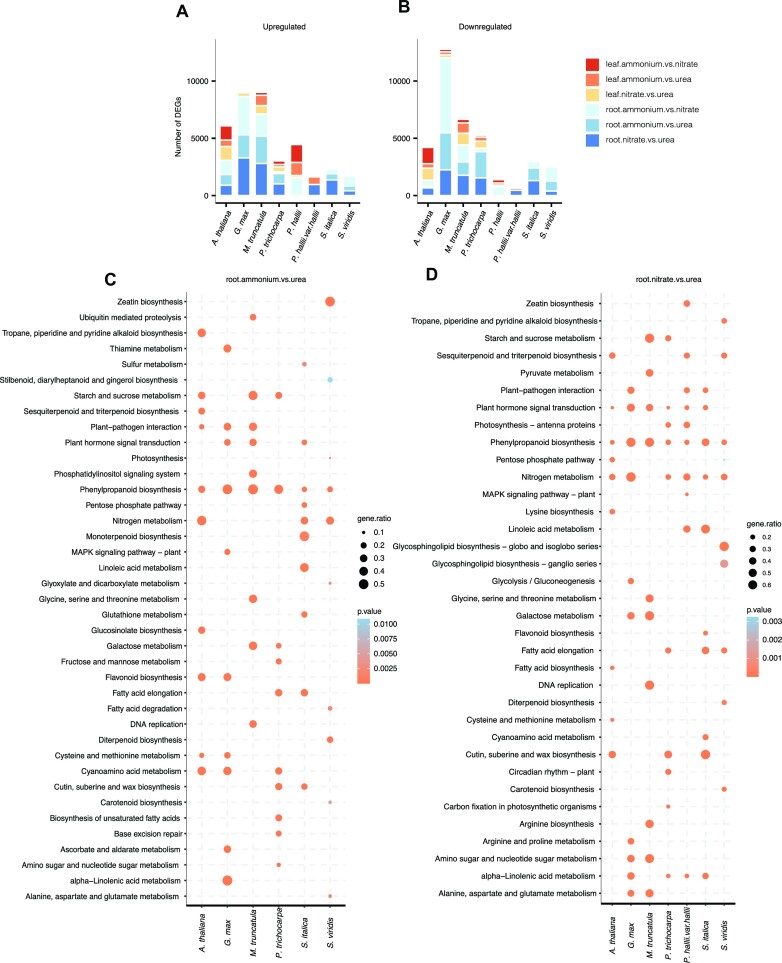
Figure 4.
Transcriptional response of Gene Atlas plants towards NH4+ and NO3− compared to urea as the sole nitrogen source in root and leaf tissues. Numbers of genes differentially upregulated (A) and numbers of genes differentially downregulated in response to changing nitrogen regime (B). Top 10 KEGG metabolic pathway enrichments (P <0.05, hypergeometric test) in up-regulated differentially expressed genes in roots from Gene Atlas plants in ammonia versus urea (C) and nitrate versus urea treatment comparisons (D). ‘gene.ratio’ represents the ratio of number of DEGs over the number of genes annotated specific to the pathway.

