Figure 3.
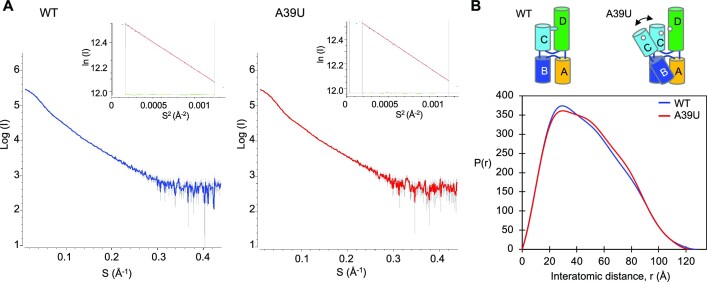
Small-angle X-ray scattering (SAXS) data analysis. (A) Scattering curves of PV wild-type and A39U mutant cloverleaf. Experimental scattering patterns for PV wild-type cloverleaf (0.95 mg/ml, blue) and A39U mutant cloverleaf (0.89 mg/ml, red) are shown. In the Guinier plot (inset), the Guinier region (qRG < 1.3) is delimited by the gray vertical lines. The red solid lines are the linear regression fit in the Guinier region, and the residuals are colored green. The radius of gyration (RG) determined from the Guinier plot is 36.2 and 36.9 Å for wild-type and A39U cloverleaf, respectively. (B) Pairwise distance distribution function P(r) analysis of PV wild-type and A39U mutant cloverleaf. The pairwise distance distribution function P(r) calculated from the SAXS curves shows that the A39U mutant displays an increased population in the 50–80 Å interatomic distance range compared to the wild-type, consistent with a conformational change within cloverleaf. The radius of gyration (RG) and maximal distance (Dmax) determined from the pairwise distance distribution function are 38.0 and 128 Å for wild-type and 38.2 and 124 Å for A39U mutant. In comparison, the RG and Dmax values calculated from the crystal structure are 38 and 130 Å, respectively.

