Figure 1.
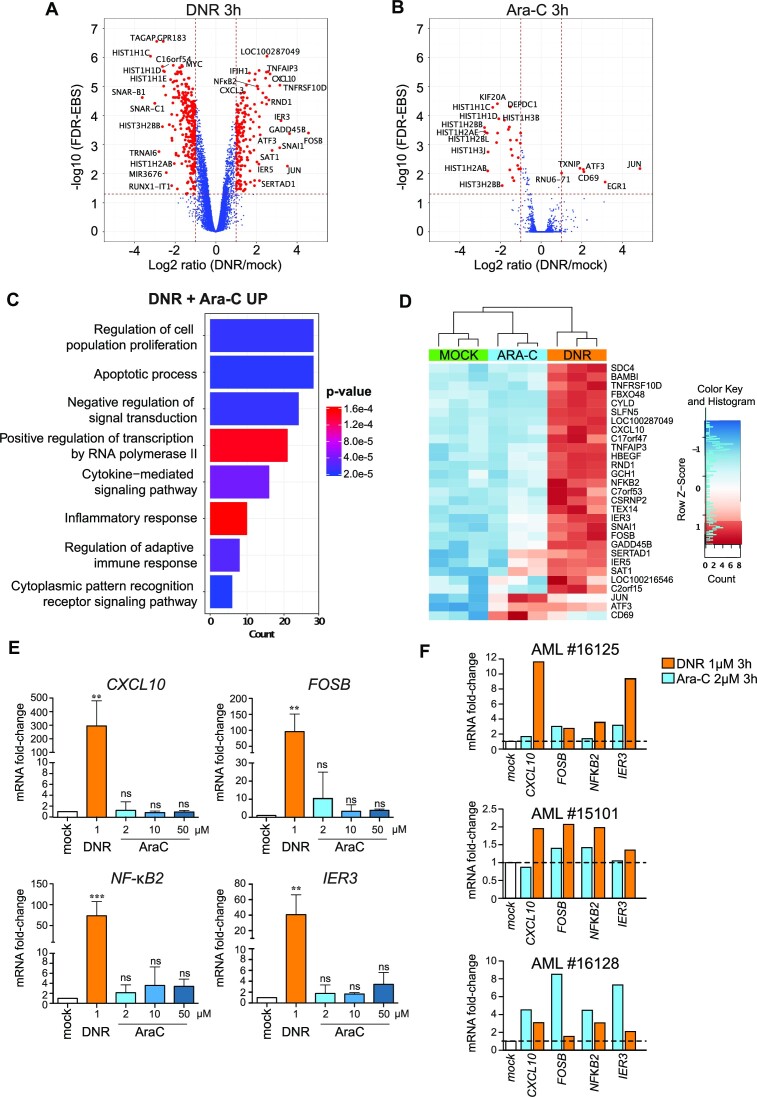
Chemotherapeutic drugs rapidly alter the expression of genes involved in cell death and inflammation in AML cells. (A, B) Trancriptome profile. HL-60 cells were treated with 1 μM DNR (A) or 2 μM Ara-C for 3 h (B). RNAs were purified from three independent experiments and used to probe Affymetrix Human Gene 2.0 ST Genechips. The red dots on the Volcano plots represent the Differentially Expressed genes (DEG) with an absolute Fold Change (FC) ≥ 2 (log2 ≥ 1) and a False Discovery Rate (FDR) corrected with Empirical Bayes Statistics (EBS) (89) <0.05. (C) Gene Ontology enrichment analysis of the genes up-regulated (≥2 fold) by DNR and Ara-C. Ontologies were performed using the Panther GO database (51). The main terms of each identified group are presented on the graph and classified by the number of genes present in each group. P values are corrected with Bonferroni step down. (D) Heatmap of DEG with a FC≥4 in the transcriptomic experiments presented in (A) and (B). The data for all three replicates are represented. (E) RT-qPCR analysis of selected genes. HL-60 cells were treated for 3 h with 1 μM DNR or 2 μM Ara-C. The levels of the indicated mRNAs were measured by RT-qPCR, normalized to GAPDH levels and expressed as fold increase to mock-treated cells (mean ± SD, n = 7 for NF-κB2, n = 6 for IER3, n = 5 for FOSB, CXCL10). (F) Regulation of selected genes in primary AML cells. AML cells (bone marrow aspirate) from three patients were treated in vitro with 1 μM DNR or 2 μM Ara-C for 3 h. The levels of the indicated mRNAs were measured by RT-qPCR, normalized to TBP levels and expressed as fold increase to mock-treated cells.

