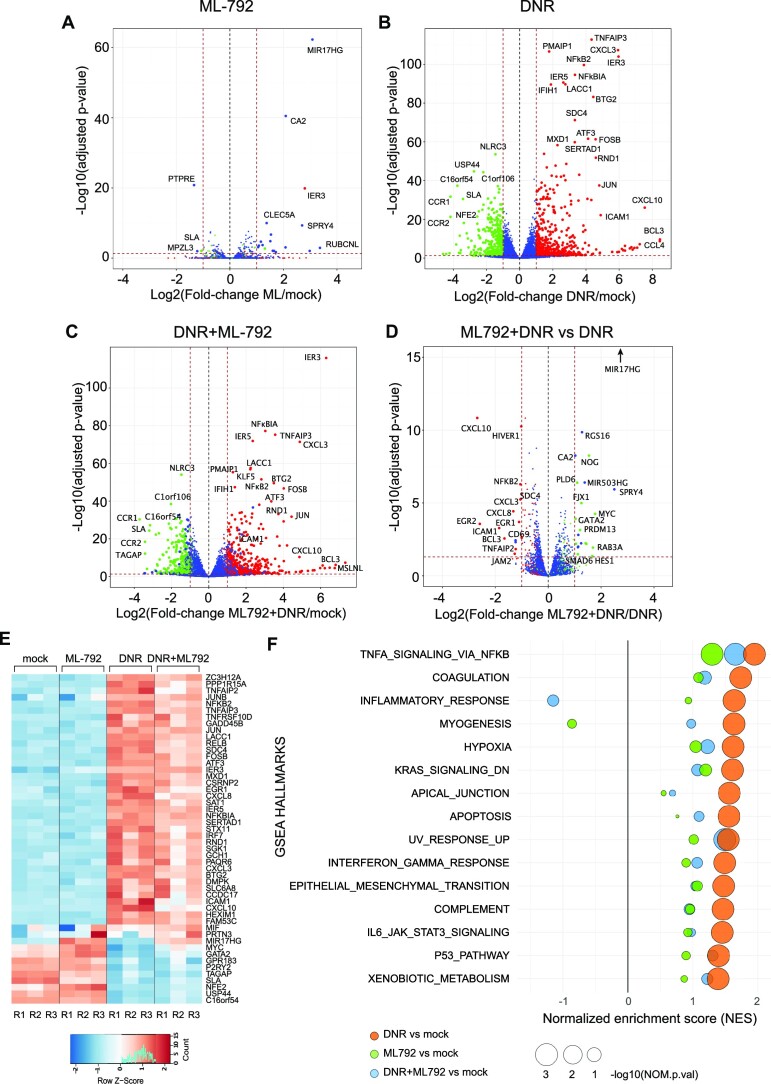
Figure 3.
Inhibition of SUMOylation reduces the DNR-induced regulation of a subset of genes. (A–E) HL-60 cells were treated with 1 μM DNR, 0.5 μM ML-792 or the combination of the two drugs for 3 h. Total RNAs were prepared from three independent experiments and sequenced. Volcano plot showing the DEG between (A) ML-792- and mock- (B) DNR- and mock-, (C) ML-792 + DNR- and mock-, (D) ML-792 + DNR and DNR- treated HL-60 cells. Green dot: DNR-downregulated FC ≤ -2 and FDR (false discovery rate) < 0.05; red dots: DNR-upregulated with FC ≥ 2 and FDR < 0.05; Blue dots: genes with –2 ≥FC ≤ 2 and FDR > 0.05 in the DNR vs mock conditions. (E) Heatmap of top 50 DEGs in all conditions presented in A, B and C. (F) Gene Set Enrichment Analysis (GSEA) was performed using RNA-Seq data presented in A–E. The GSEA hallmarks showing a Normalized Enrichment Score NES > 1 or < −1, a P-value < 0.05 and an FDR < 0.25 for the DNR versus mock analysis are presented for each treatment condition (DNR, ML-792, DNR + ML-792) compared to the mock-treated cells.

