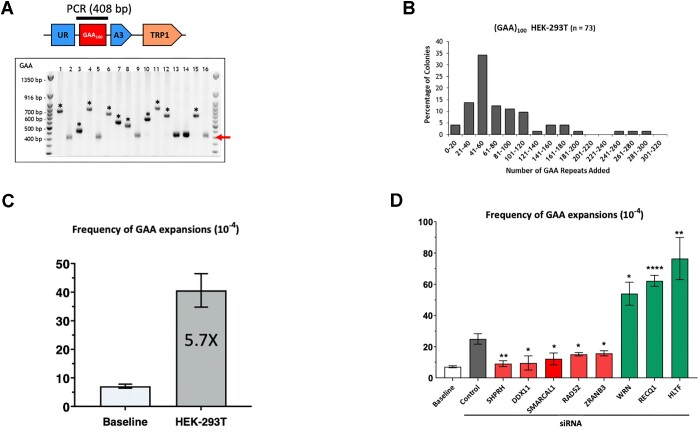
Figure 2.
GAA•TTC repeat expansion upon candidate gene knockdown by siRNA. (A) Confirmation of GAA•TTC expansions in HEK-293T cells. Repeat lengths in 5-FOA-resistant colonies from independent experiments were analyzed by PCR. On the upper part, a cartoon representation of a cassette with a bar above the GAA•TTC repeats indicates the product of single-colony PCR, used to determine the repeat length. The red arrow points to the length of the PCR product carrying the starting (GAA)100•(TTC)100 repeat. ‘*’ marks large-scale GAA•TTC expansions. Only clones with expansions were used to calculate expansion frequencies in (D). (B) Distribution of repeats added to the (GAA)100•(TTC)100 repeat during plasmid replication in HEK-293T cells (dark grey bars). The geometric mean of repeats added is 65 repeats (interquartile range 44.5–100.5). (C) Expansion frequencies for pJC_GAA100 plasmid derived from E. coli (baseline) and HEK-293T cells. Error bars indicate the standard error of the mean. ‘*’ P< 0.05 and ‘**’ indicates a P< 0.001 in two-way Welch ANOVA test. (D) Expansion frequencies following siRNA gene knockdown in HEK293T cells. The baseline expansion frequency upon yeast transformation by plasmid DNA isolated from E. coli (white bar) is shown for the comparison. Error bars indicate the standard error of the mean. Significance compared to the siControl frequency value was determined using a two-way Welch ANOVA test, ‘#’ P< 0.05 versus baseline, ‘*’ P< 0.05, ‘**’ indicates a P< 0.001 versus siControl. See Supplementary Table S1 for details.

