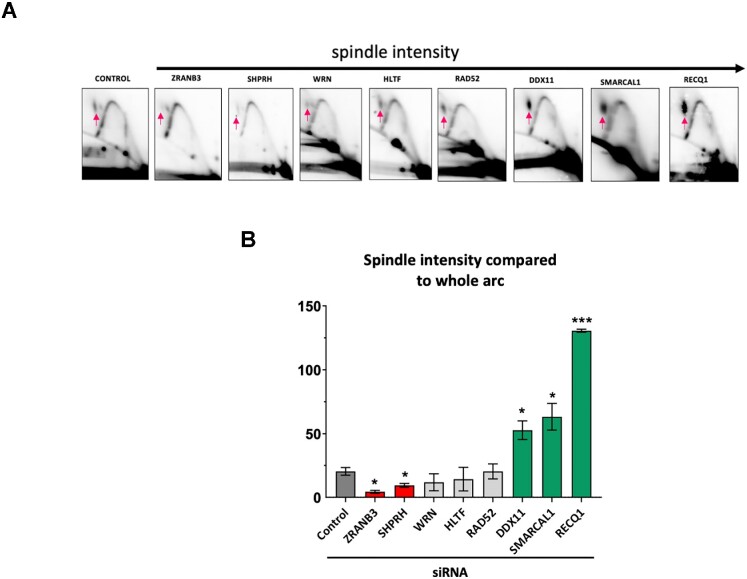
Figure 4.
Analysis of replication through GAA•TTC repeats by two-dimensional (2D) agarose gel electrophoresis upon candidate gene knockdown by siRNA. (A) Representative 2D gels of replication through the (GAA)100•(TTC)100 repeats in HEK-293T cells. DNA was isolated, digested with BsrG1, DpnI and XbaI, and analyzed by 2D gel. The red arrow points to the location of the stalling at the GAA•TTC repeats. At least three experiments were analyzed for each siRNA treatment. (B) Quantification of the spindle spot at the replication fork. The ratio of radioactivity signal at the spindle spot was compared to the radioactivity signal of the whole arc using Image Lab®. Error bars indicate the standard error of the mean. ‘*’ P< 0.05, ‘***’ indicates a P< 0.0001 versus siControl. See Supplementary Table S2 for details.

