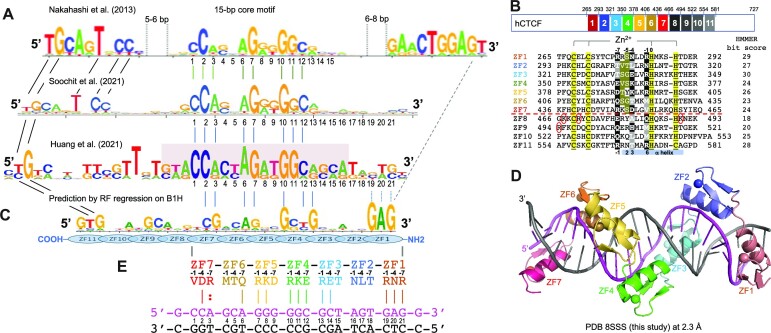
Figure 1.
CTCF has two subgroups of ZFs. (A) Three examples of CTCF-binding consensus CORE sequence (base pairs 1–15) with flanking 5′ upstream and 3′ downstream motifs. One notable difference is that the CORE sequence and the 3′ motif separated by a large spacing in (26) would not match to the binding by a single CTCF molecule. (B) Human CTCF contains a tandem ZF DNA binding array comprising 11 fingers (GenBank: AAB07788.1). Sequence alignment of the 11 C2H2 fingers with variations at DNA base-interacting positions −1, −4, −7 and –8. For comparison, the four ‘canonical’ positions of the helix are indicated at the bottom of the sequence. To the right, the HMMER algorithm has calculated the bit score for each finger and all of them have fairly high confidence scores, the lowest being 18 and the highest being 30 (http://zf.princeton.edu/index.php). Differences at positions −5 and −6 separate the two subgroups. The circled basic residues are unique to ZF8 or the linker between ZF8 and ZF9 of CTCF. (C) A predicted CTCF ZF1–ZF11 DNA-binding specificity is aligned with the consensus. A notable divergence from the consensus involves ZF1–ZF2 and ZF8–ZF11, whereas the predicted DNA-binding specificity of ZF3–ZF7 matches to the consensus CORE sequence. (D) A ribbon model of ZF1–ZF7 in complex with DNA. (E) Illustration of ZF1–ZF7 (oriented right to left from N to C termini) and the three base-interacting residues per finger at positions –1, –4 and –7. The double-stranded DNA oligonucleotides used for co-crystallization are shown with the top recognition strand (magenta) oriented left to right from 5′ to 3′. The vertical lines indicate base–amino acid specific interactions.

