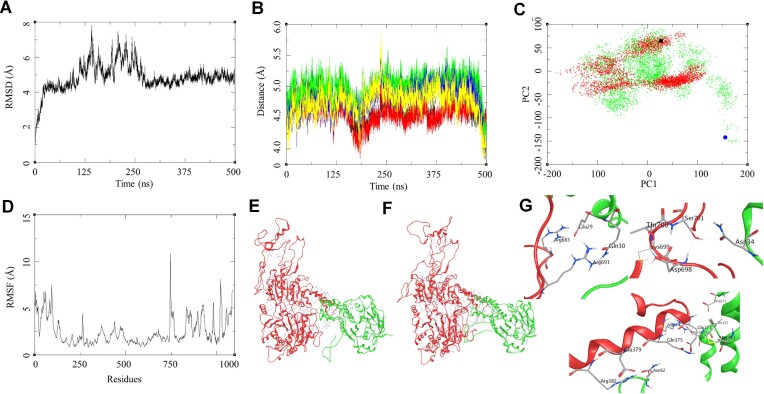
Figure 7.
Modelling studies on the RAD51-RAD54-WT interaction. (A) RMSD of the RAD51-RAD54-WT complex over 500 ns. (B) Distance based hydrogen bond analysis: (1) GLU371-HIS244 (black), ARG374-ASP198 (red), GLU378-LYS64 (green), ARG691-GLU29 (blue). (C) Principal component analysis (PCA) for RAD51-RAD54-WT (red), black marker as the reference complex structure and RAD51-RAD54-T700D -Mutant (green), blue marker as the reference complex structure. (D) RMSF of the RAD51-RAD54-WT complex over 500 ns. (E) Initial state of RAD51-RAD54-WT complex at the beginning of 500 ns. (F) Final state of RAD51-RAD54-WT complex at the end of 500 ns. (G) Residue level interaction between RAD51 and the RAD54, Arg683-Glu29, Arg691-Gln30, Ser701-Asn34, Asp698-Ser701, Glu379-Asn62, Arg382-Asn62, Gln375-Met243 and Arg374-Glu37.

