Figure 7.
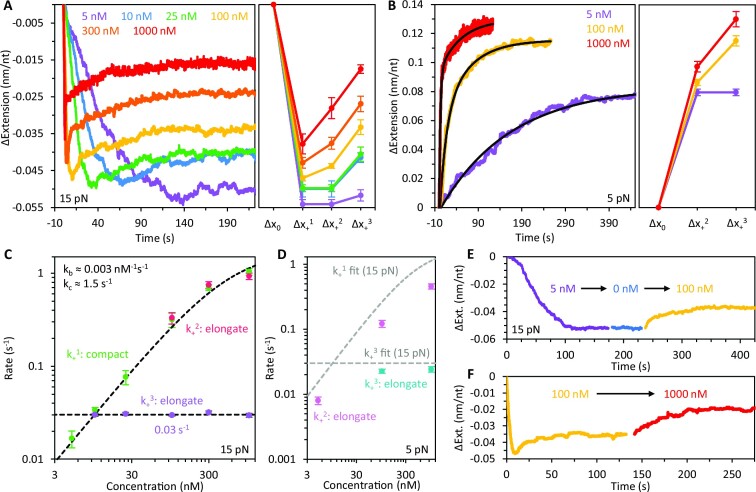
Concentration dependence of gp32 binding. (A) Representative curves (left) and average extension changes (right) associated with binding of gp32 as a function of free protein concentration at 15 pN. Both the maximum initial compaction (Δx+1) and the equilibrium extension reduction of the ssDNA decrease with protein concentration. Rapid elongation (Δx+2) is only observed at concentrations ≥100 nM. Additionally, slow partial elongation of the DNA (Δx+3) vanishes at 5 nM. Under the conditions in which we observe biphasic elongation, the curves are fit with a two-rate decaying exponential to extract the rates and amplitudes of those phases. (B) Representative curves (left) and average extension changes (right) associated with the binding of gp32 as a function of concentration at 5 pN. The elongation of the ssDNA is biphasic at concentrations ≥100 nM, marked by an initial rapid increase in DNA extension (Δx+2) which is followed by a slower elongation event that equilibrates to a final extension (Δx+3). Both the transient elongation and the equilibrium extension of the ssDNA increase with protein concentration. (C) The rate of each binding phase is calculated as a function of gp32 concentration at 15 pN. The rate of compaction (k+1, green) initially increases linearly with concentration before approaching an asymptote at high protein concentration. The rate of rapid elongation (k+2, red) increases with concentration and is approximately equivalent to the initial compaction rate. The slow elongation step (k+3, purple), however, is independent of the free protein concentration. (D) The rate of each binding phase is calculated as a function of gp32 concentration at 5 pN. The initial elongation of the DNA (k+2, pink) increases with concentration. However, this rate is ∼2-fold slower than at 15 pN (fit line from C replotted in grey for comparison). The secondary elongation step (k+3, blue) is slightly slower than that measured at 15 pN (fit line from C replotted in grey for comparison). (E) ssDNA compaction was monitored during sequential changes in protein concentration. In the presence of 5 nM gp32 (purple), the ssDNA exhibits compaction without subsequent elongation. When free protein is rinsed out (blue) and replaced with 100 nM gp32 (yellow), the extension increases and equilibrates to a length consistent with that observed when the DNA is incubated directly with 100 nM (panel A, yellow). (F) When the concentration is switched from 100 nM (yellow) to 1000 nM (red), the complex equilibrates to an extension consistent with that observed when the DNA is incubated directly with 1000 nM (panel A, red).

