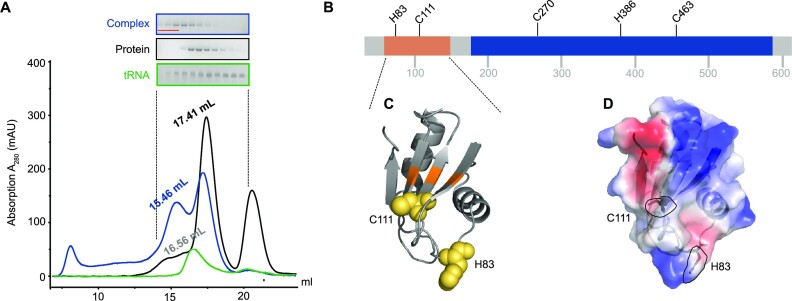
Figure 3.
tRNAGln contacts various amino acids from all hTRMT2A domains. (A) Size exclusion chromatography profile from a size exclusion chromatography run with an S6 (15/150) column with hTRMT2A FL and tRNAGln, as well as the stable protein–RNA 1:1 complex. SDS–PAGE and denaturing PAGE of protein, RNA and their complex are shown. Pooled fractions for cross-linking experiments are highlighted in red. (B) Cross-linked amino acids are mapped on a linear representation of hTRMT2A FL and those consistently cross-linked in three or four of four datasets are shown. (C) Cross-linked amino acids (yellow) are mapped on the hTRMT2A RBD X-ray structure (PDB ID: 7NTO), and the predicted RNA-binding surface is colored orange. (D) Electrostatic surface potential of hTRMT2A RBD and the position of cross-linked amino acids H83 and C111 (dashed lines, stick representation). The positive (blue) and negative (red) charge profile was prepared with the PyMOL APBS plugin. Figures were prepared with PyMOL (version 2.0.4).

