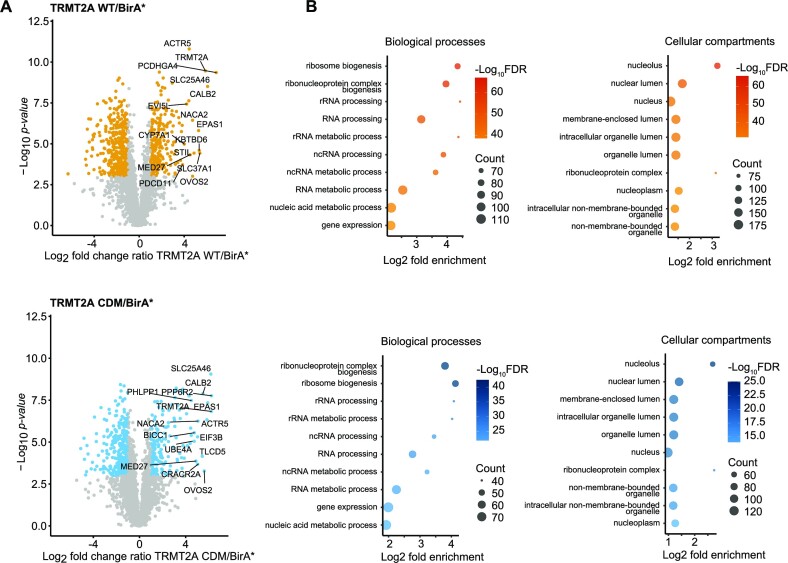
Figure 5.
hTRMT2A WT and CDM interactome from BioID experiments. (A) Volcano plots of hTRMT2A WT and hTRMT2A CDM BioID experiments show enriched proteins and was performed in quintuplicates. Log2 fold change ratio of hTRMT2A WT (BirA*-tagged)/BirA* background and hTRMT2A CDM (BirA*-tagged)/BirA* background was plotted against –log10P-value. Ratio cut-offs were > 2 and < 0.5, and significance cut-off with a P-value < 0.05. Hits in agreement with these thresholds are highlighted in yellow (WT) and blue (CDM), respectively. The top 10 hits are labeled with protein names. (B) The top 10 most enriched GO terms for biological processes and cellular compartments of hTRMT2A WT (upper panel) and hTRMT2A CDM (lower panel) BioID experiments show enrichment of rRNA processing and ribosome biogenesis processes and the nucleolus as the most enriched cellular compartment. GO terms were ranked according to the FDR as computed with Fisher's exact test. Graphs illustrate GO terms plotted against log2 fold enrichment. Node color represents –log10 FDR. Node size represents counts per GO term. GO terms were visualized in R.

