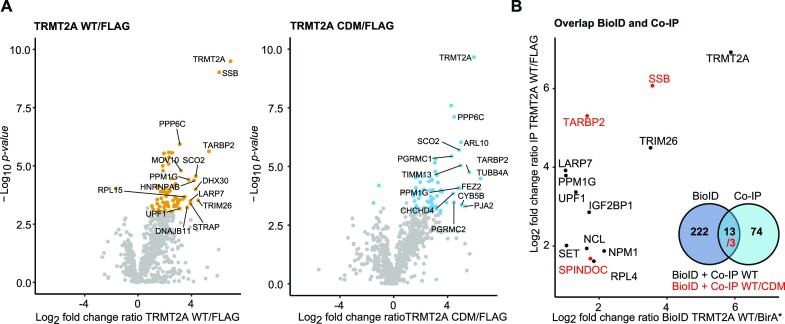
Figure 6.
Potential interaction partners of hTRMT2A. (A) Volcano plots of hTRMT2A WT and hTRMT2A CDM Co-IP experiment show enriched proteins and were performed in quintuplicates. Log2 fold change ratio of hTRMT2A WT (FLAG-tagged)/FLAG background and hTRMT2A CDM (FLAG-tagged)/FLAG background was plotted against –log10P-value. Ratio cut-offs were > 2 and < 0.5, and significance cut-off of P-value < 0.05. Hits in agreement with these thresholds are highlighted in yellow (WT) and blue (CDM), respectively. The top 10 hits are labeled with protein names. (B) Overlap of significant hits from hTRMT2A WT BioID and Co-IP data shown as a plot of the respective ratios (black). Overlap of significant hits from hTRMT2A WT and CDM, BioID and IP experiments (red) shown in the same plot. Venn diagram summarizes overlap of BioID and Co-IP datasets.

