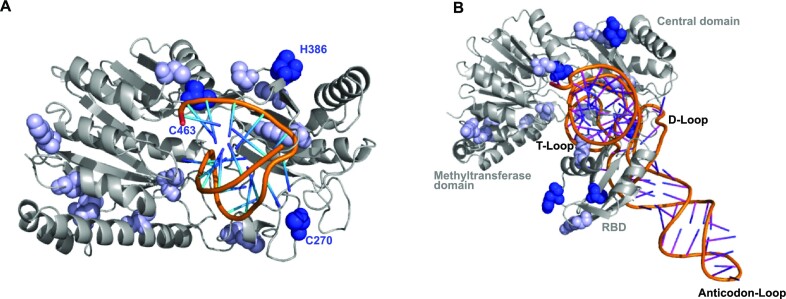
Figure 8.
Model of the hTRMT2A–tRNA complex. (A) hTRMT2A AlphaFold homology model (gray) overlaid with the T-loop from the E. coli TrmA structure (PDB ID: 3BT7; orange). Consistently (blue spheres, three of four datasets) and less consistently (bright blue spheres, <3 of four datasets), cross-linked amino acids were mapped onto the model. (B) Hybrid model consisting of the hTRMT2A AlphaFold homology model (gray) and an overlaid experimental full tRNA structure (PDB ID: 4TRA) based on the superposition with the E. coli TrmA T-loop co-structure (PDB ID: 3BT7). Cross-linked amino acids from MS experiments are highlighted (coloring as in A) and mapped onto the hybrid model. Models were generated with PyMOL.

