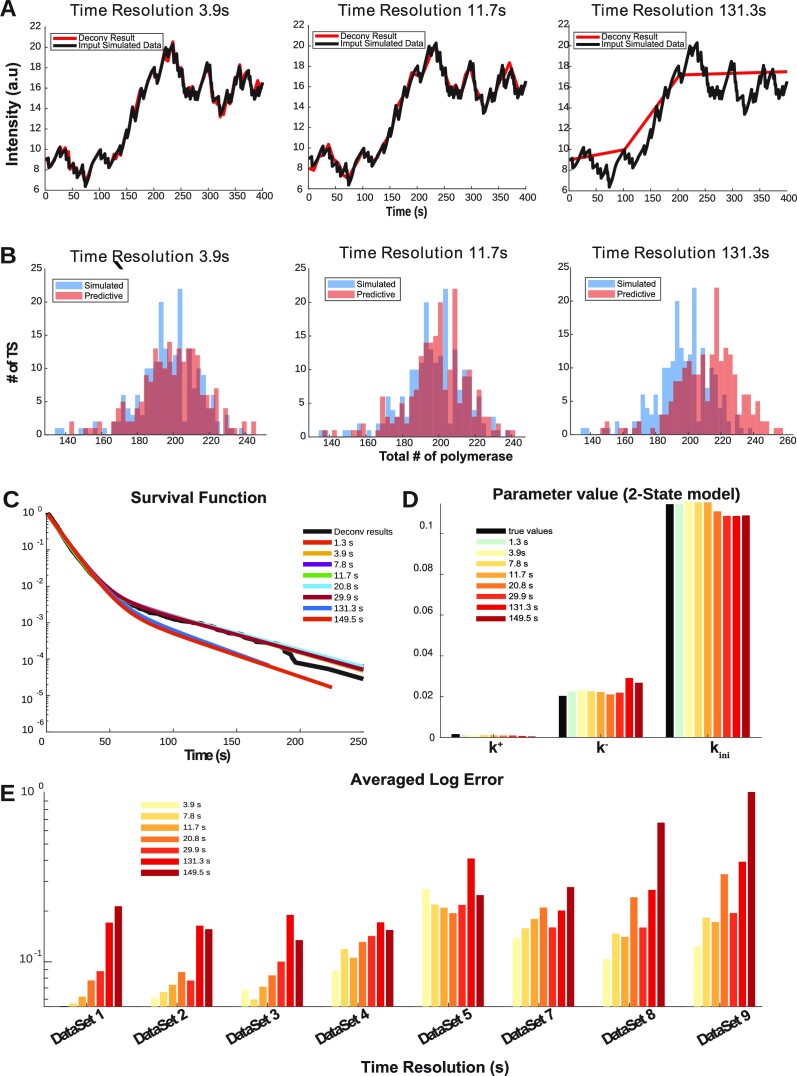
Figure 7.
Testing the effect of a change in the movie time resolution. (A) Simulated and reconstructed signal for different time resolutions, for a two state model, dataset D1 in Table 1. The simulated transcription site signal is represented in black. The same signal is resampled with different rates and then reconstructed by deconvolution. The reconstructed signal (after deconvolution and with different sampling rates) is represented in red. (B) Histograms of the number of polymerases per analysed site for different time resolutions. (C) The reconstructed survival functions for different time resolutions. (D) Average logarithmic parametric reconstruction error for different time resolutions and kinetic parameters (dataset D1). (E) Average logarithmic error for different datasets and time resolutions.

