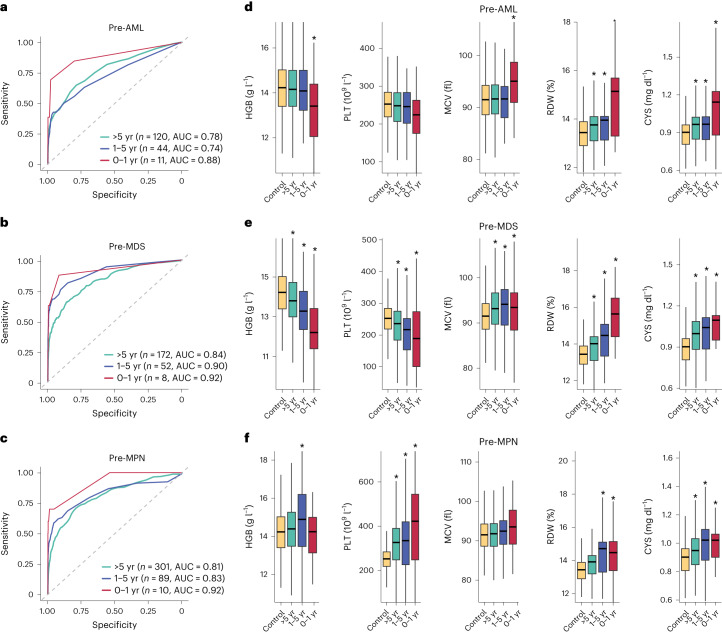
Fig. 4. Time-dependency of predictive models and blood parameters in relation to myeloid neoplasm diagnosis.
a–c, Time-dependent ROC curves computed using predicted outcomes on the validation set versus clinical diagnoses of myeloid neoplasm in 0–1 year, 1–5 years and over 5 years after blood sampling in pre-AML (a), pre-MDS (b) and pre-MPN (c) participants. ROC curves were computed using the incident/dynamic method (see Methods for details); n = number of individuals with the relevant diagnosis in the validation set. d–f, Impact of time to diagnosis on the distribution of HGB, PLT, MCV, RDW and CYS in pre-AML (d), pre-MDS (e) and pre-MPN (f) participants, respectively, compared with controls. (*P < 0.05 Wilcoxon rank-sum test; see Supplementary Table 10 for details). In the box plots, central lines indicate medians, boxes indicate 25–75% quantiles and ranges indicate 1.5 interquartile ranges from the upper or lower quartiles.

