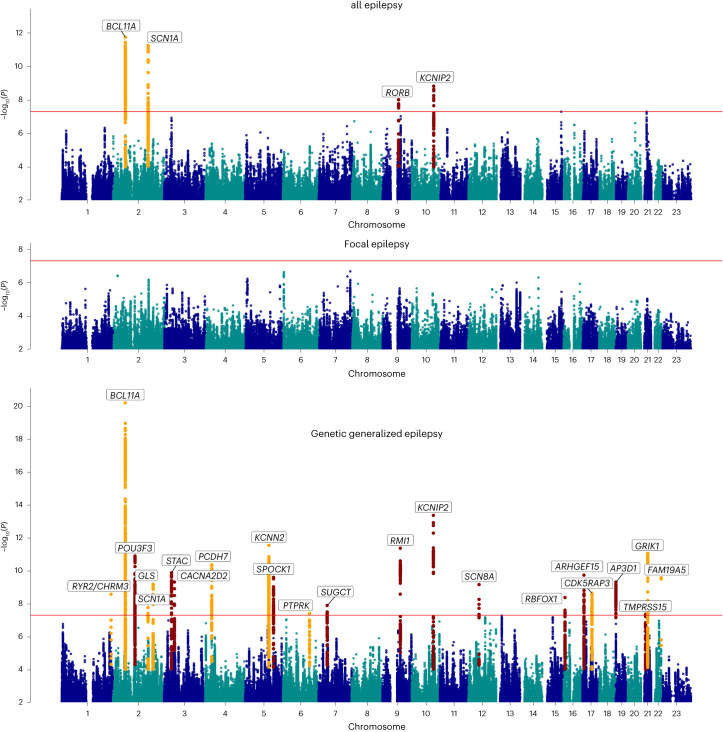
Fig. 1. Manhattan plot of multi-ancestry all epilepsy (n = 29,944), focal epilepsy (n = 16,384) and genetic generalized epilepsy (n = 7,407) genome-wide meta-analyses, obtained by fixed-effects meta-analysis weighted by effective sample sizes.
The red line shows the genome-wide significance threshold (5 × 10⁻⁸). Chromosome and position are displayed on the x axis, and two-sided −log10 P value is on the y axis. New genome-wide significant loci are highlighted in red, and loci previously associated with epilepsy in orange. New loci were those previously unreported as GWAS significant in previous epilepsy GWASs. Annotated genes are those implicated by our gene prioritization analyses. See Supplementary Fig. 7 for QQ plots. QQ plots, quantile–quantile plot.

