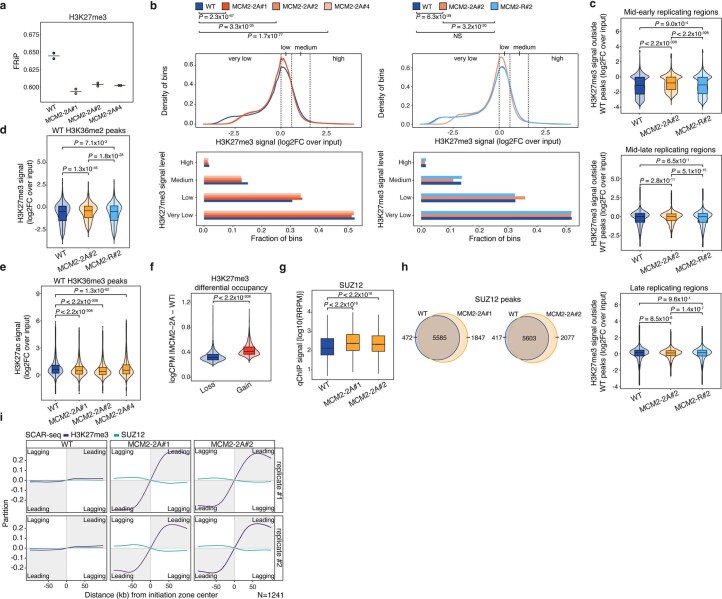
Extended Data Fig. 5. Global increase of H3K27me3 and SUZ12 levels in MCM2-2A.
a, Fraction of reads in peaks (FRiP) as quality control for H3K27me3 ChIP-seq peaks. Fewer reads fall into peaks in MCM2-2A clones compared to WT cells, indicating that peak calling for H3K27me3 is affected in MCM2-2A (n = 2 biological replicates for each clone). b, Density plots (top) showing distribution of H3K27me3 signal in genome-wide 5-kb bins. Two-sided Wilcoxon signed-rank test P values. Bar plots (bottom) showing quantification of bins in the indicated signal categories. Three MCM2-2A clones (left; average of n = 2 biological replicates) and MCM2-R cells (right; average of n = 3 biological replicates) demonstrate similar trends across mutant clones and rescue of signal redistribution upon restoration of symmetric recycling. c, Violin plots showing H3K27me3 signal in bins non-overlapping WT peaks in early, mid-early, mid-late and late replicating regions, related to Fig. 2d. Two-sided Wilcoxon signed-rank test P values. n = 3 biological replicates. d, Violin plot showing H3K27me3 signal in 5 kb bins overlapping WT H3K36me2 peaks. Two-sided Wilcoxon signed-rank test P values. n = 3 biological replicates. e, Violin plot showing H3K27ac signal in 2.5-kb bins overlapping WT H3K36me3 peaks. Two-sided Wilcoxon signed-rank test P values. n = 2 biological replicates. f, Violin plot showing absolute differences in H3K27me3 signal between WT and MCM2-2A in bins of H3K27me3 gains and H3K27me3 losses. Two-sided Wilcoxon signed-rank test P values. n = 3 biological replicates. Related to Fig. 2f. g, Increased SUZ12 binding to chromatin in MCM2-2A cells shown by box plots of mean SUZ12 levels in 1 kb windows of SUZ12 peaks quantified by qChIP-seq. Two-sided Wilcoxon signed-rank test P values. n = 3 biological replicates. c-g, Box plots as in Fig. 2a. h, Venn diagrams illustrating strong overlap of SUZ12 peaks in WT, MCM2-2A#1 and MCM2-2A#2 clones (n = 3 biological replicates). i, Individual SUZ12 SCAR-seq replicates related to Fig. 2j, including two MCM2-2A clones. H3K27me3 SCAR-seq was performed in parallel as control for crosslinked SCAR-seq. SCAR-seq is represented as in Fig. 1.

