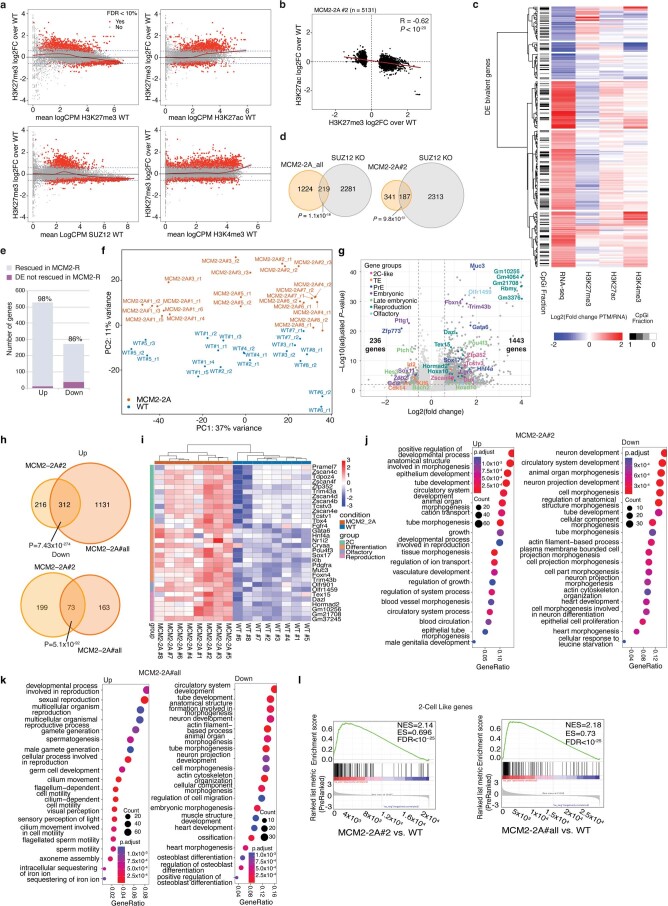
Extended Data Fig. 7. H3K27me3 changes at gene promoters correlate with differential gene expression in MCM2-2A cells.
a, MA plots showing H3K27me3 DO in MCM2-2A#2 relative to the H3K27me3, SUZ12, H3K27ac and H3K4me3 signal in WT cells. H3K27me3 DO was analyzed in 5-kb bins overlapping H3K27me3 WT promoters and H3K27me3, SUZ12, H3K27ac and H3K4me3 signal is depicted as mean log2 counts per million (CPM). n = 3 biological replicates. b, Correlation of H3K27me3 and H3K27ac DO at promoters with DO of H3K27me3 (n = 5131 DO H3K27me3 bins). Two-sided Pearson’s product moment correlation coefficient. c, Hierarchical clustering of differentially expressed (DE) genes bivalent promoters (MCM2-2A#2; n = 244) according to changes in RNA, H3K27me3, H3K9me3, H3K27ac and H3K4me3 between MCM2-2A#2 and WT. d, Overlap of upregulated genes between all MCM2-2A clones (left; MCM2-2A#all, see g) or MCM2-2A#2 (right) with SUZ12-KO DE genes53. One-sided hypergeometric test P values. e, Bar plot showing number of DE genes in MCM2-2A rescued (gray) or not rescued (purple) in MCM2-R, related to Fig. 4d. Percentage of rescued genes are indicated. f, PCA plot showing a shared expression deviation of 8 MCM2-2A clones (orange) from 8 WT clones (blue) based on all expressed genes in MCM2-2A and WT. n = biological replicates; WT#1 (n = 5);WT#2, WT#3, WT#4, WT#6, WT#7, WT#8, MCM2-2A#4, MCM2-2A#5, MCM2-2A#6, MCM2-2A#7, MCM2-2A#8 (n = 2); WT#5, MCM2-2A#2, MCM2-2A#3 (n = 3); MCM2-2A#1 (n = 6). g, Differential expression analysis of WT and MCM2-2A clones in f. Selected gene are in color as indicated. Significant genes (| log2 FC | > 0.58, FDR < 0.01, Wald test) are in dark gray. FC against FDR is shown per gene in MCM2-2A versus WT. h, Overlap of DE genes between MCM2-2A#2 (see Fig. 4d) and MCM2-2A#all (see g). One-sided hypergeometric test P values. i, Heatmaps showing relative expression of selected differentially expressed genes in each of the analyzed clones. Values depict log2FC from the average of all samples. j-k, Dot plot of GO term enrichment analysis in the upregulated and downregulated MCM2-2A#2 genes (j) or MCM2-2A#all (k) (Related to Fig. 4d and g, respectively). l, 2C-like genes84 are enriched both in MCM2-2A#2 (left, see Fig. 4d) and in the shared MCM2-2A#all (right, see g) upregulated genes in gene set enrichment analysis (GSEA).

