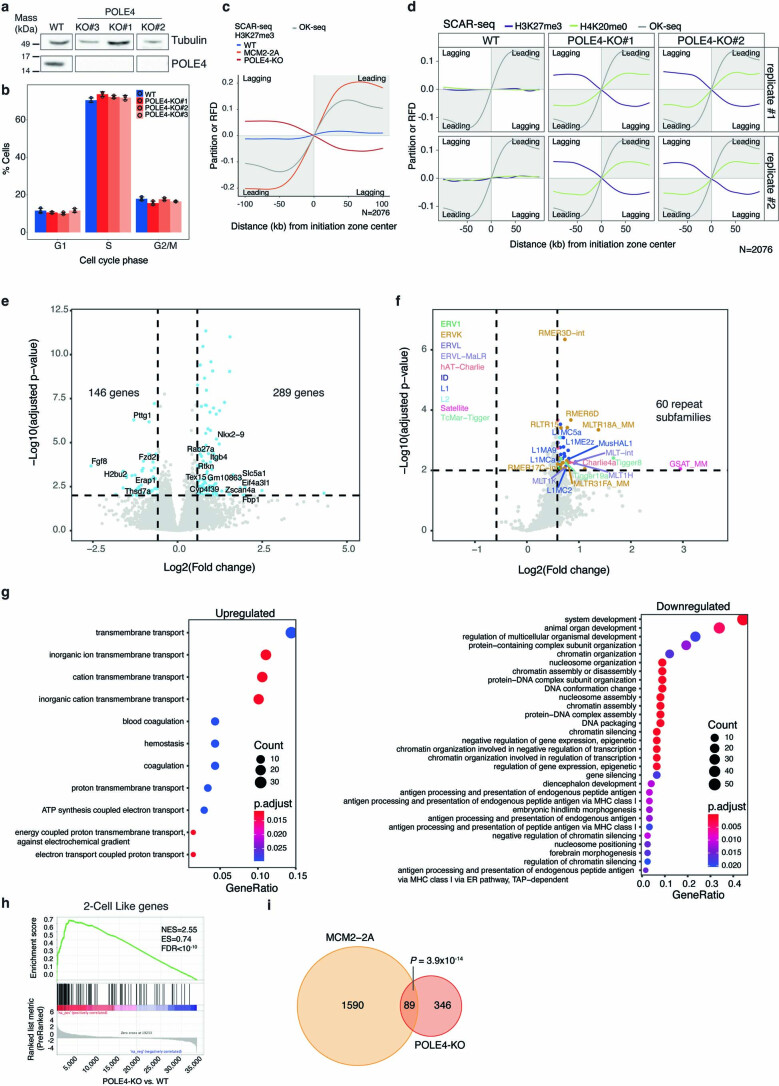
Extended Data Fig. 8. POLE4-KO ESCs shared expression changes with MCM2-2A.
a, Western blot analysis of POLE4-KO clones. b, Cell cycle distribution in three POLE4-KO ESC clones is similar to WT. Bar plot shows the fraction of cells in G1, S and G2/M phase based on flow cytometry analysis of DNA content and EdU labeling. Mean ± s.d. of n = 3 biological replicates is shown, dots depict individual data points. c, SCAR-seq profiles of H3K27me3 in POLE4-KO, MCM2-2A and WT cells represented as in Fig. 1. d, SCAR-seq analysis of nascent chromatin showing lagging strand bias of old histones (H3K27me3) and leading strand bias of new histones (H4K20me0) in two independent POLE4-KO clones. SCAR-seq average profiles are shown as in Fig. 1. e, Volcano plot showing differential expression analysis. FC against FDR is shown per gene in POLE4-KO versus WT. Significant genes | log2 FC | > 0.58, FDR < 0.01, Wald test, are depicted in light blue. n = biological replicates; WT#1 (n = 3), POLE4-KO#1 (n = 3), POLE4-KO#2 (n = 3), POLE4-KO#3 (n = 3). f, Volcano plot showing differential repeat expression between POLE4-KO to WT. FC against FDR is shown per repeat subfamily-n. Significant subfamilies | Log2FC|> 0.58, FDR < 0.01, Wald test, are colored according to repeat family. n as in e. g, Dot plot of GO term enrichment analysis of biological processes in the downregulated genes and upregulated genes. h, Gene set enrichment analysis (GSEA) of 2C-like genes84 among POLE4-KO upregulated genes. i, Venn diagram illustrating overlaps of DE genes in POLE4-KO and MCM2-2A cells. P-values, one-sided hypergeometric test.

