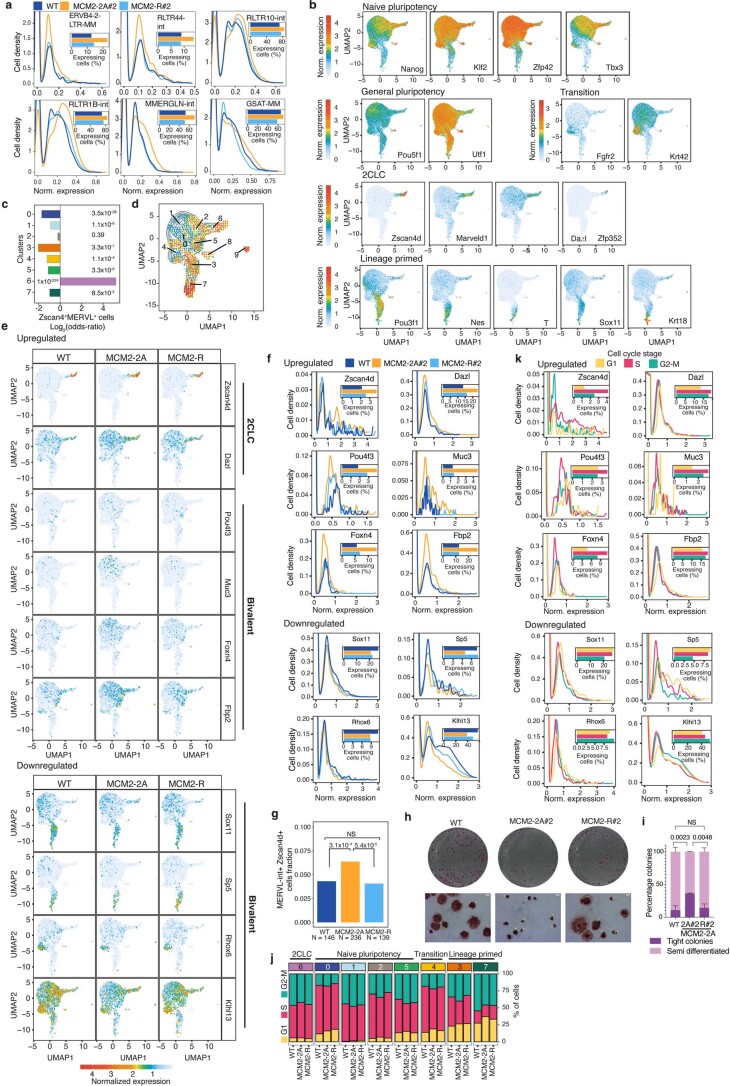
Extended Data Fig. 9. Timely transitions in cellular states are impaired in MCM2-2A cells.
a, Expression values and cell quantifications for selected repeats DE in the total RNA-seq. Positive WT, MCM2-2A#2 and MCM2-R#2 cells are depicted in bar plot. b, UMAP embedding showing expression of gene markers used to classify ESC subpopulation clusters (see Fig. 5a). c, Enrichment of Zscan4 and MERVL double positive cells across the single cell clusters, related to Fig. 5a. d, Velocity plot for combined population of all 3 cell lines based on splicing kinetics showing the transcriptional dynamics intrinsic to the trajectories between the different clusters. e, WT, MCM2-2A#2 and MCM2-2A-R#2 cells projected on the common UMAP, showing the expression of selected gene markers, bivalent and 2CLC genes DE in total RNA-seq. Bivalent upregulated genes are over-represented in the naïve pluripotency cluster region. f, Density plots for genes from e across cells in WT, MCM2-2A#2 and MCM2-R#2 clones. Plots as in a. g, Cells double positive for Zscan4 and MERVL expression in WT, MCM2-2A and MCM2-R. Chi-square tests P values comparing cell counts for each cell line. h, Representative images of l 6-wells containing alkaline phosphatase-stained colonies from WT, MCM2-2A#2 and MCM2-R#2 cells. Zoom-in bright-field images (below). Scale bar = 1 mm. Yellow asterisks, tight undifferentiated colonies. i, Quantification of colonies from (h). Mean percentages are represented with ±s.d., n = 3 biological replicates. One-way ANOVA statistical test P values. j, Cell cycle distribution of single cells in each of the clusters in WT, MCM-2A and MCM2-R displayed as relative cell amount (that is, percentage). Note that the relative cell cycle distribution does not provide information on the total number of cells in each cluster. k, Density plots showing expression values and cell quantifications for genes from e across all analyzed cells (MCM2-2A, WT and MCM2-R) in the different cell cycle phases G1, S and G2/M. Positive cells in the cell cycle phases G1, S and G2/M are depicted in a bar plot.

