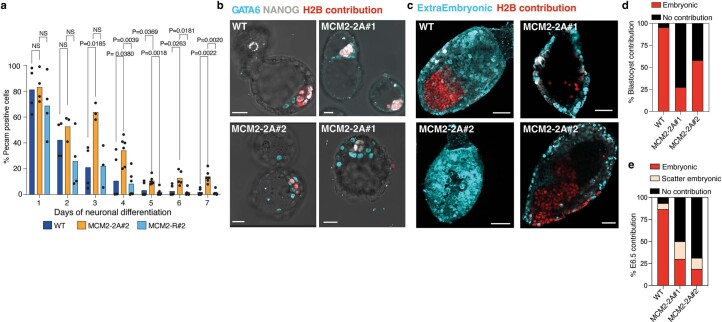
Extended Data Fig. 10. MCM2-2A mutation impairs differentiation in vitro and in vivo.
a, Bar plots representing the mean of PECAM-1 positive cells quantified by flow cytometry in a 7-day time course of neuronal differentiation. Dots depict individual data points. n = 6 biological repeats. Two-way ANOVA Statistical test P values. b, c, Representative IF images of chimeric embryos from 4-cell injected morulae cultured until the hatched blastocyst stage in vitro equivalent of E4.5 (b, scale bar, 20 µm) and injected morula at E6.5 (c, scale bar 50 µm). (c) Images on the left are stacks of multiple fields, images on the right are individual optical sections. Top left and bottom right show embryonic contribution, top right shows scatter embryonic contribution and bottom left image shows an example of no contribution as quantified in d. d, Quantification of chimera contribution at blastocyst stage from 4-cell injections. n = number of embryos; 21, 22, 19, left to right. e, Quantification of chimera contribution at E6.5 from 4-cell injections. n = number of embryos; 15, 10, 16, left to right.

