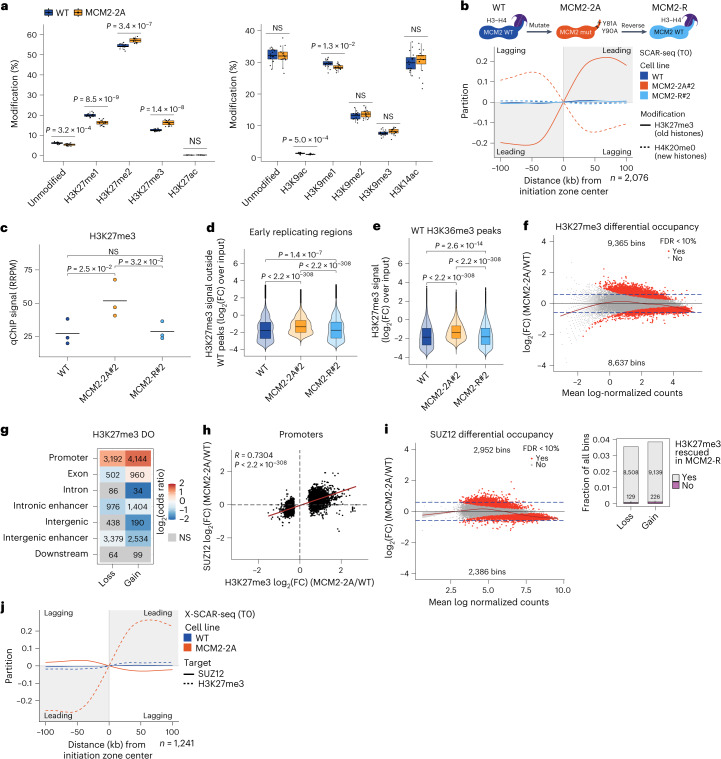
Fig. 2. MCM2-2A cells show unscheduled H3K27me3 accumulation.
a, Global histone PTM levels quantified by mass spectrometry. n = biological replicates; WT#1 (n = 4), WT#2 (n = 4), WT#3 (n = 4), WT#4 (n = 4), MCM2-2A#1 (n = 4), MCM2-2A#3 (n = 4), MCM2-2A#4 (n = 4) and MCM2-2A#5 (n = 4). Two-sided t test. Lines indicate median, boxes represent first and third quartiles and whiskers extend 1.5× IQR. b, SCAR-seq profiles showing symmetric histone segregation in MCM2-R cells (as in Fig. 1). c, Global H3K27me3 levels measured by qChIP–seq. n = 3 biological replicates. Two-sided paired t test. d, H3K27me3 signal in 5-kb bins outside WT peaks in early replicating regions. n = 3 biological replicates. Two-sided Wilcoxon signed-rank test. Box plots as in a. e, H3K27me3 signal overlapping WT H3K36me3 peaks. n = 3 biological replicates. Two-sided Wilcoxon signed-rank test. Box plots as in a. f, H3K27me3 differential occupancy (DO) in MCM2-2A#2 versus WT in 5-kb bins overlapping H3K27me3 WT peaks (top) and bar plot showing rescue in MCM2-R 2 (bottom). Significant DO bins (red), False discovery rate (FDR) < 0.1, Bayes quasi-likelihood F test (Supplementary Methods). n = 3 biological replicates. g, Enrichment analysis (odds ratios) of H3K27me3 DO according to genome annotation. Significant states (P < 0.001, two-sided Fisher’s exact test) are colored according to enrichment (red) or depletion (blue), and NS states are shown in gray. n = number of bins. h, Correlation of H3K27me3 and SUZ12 DO at promoters with DO of H3K27me3 (n = 6,660). Two-sided Pearson’s correlation coefficient (R) with P value. Average of n = 3 biological replicates. i, SUZ12 DO in MCM2-2A 2 versus WT in 2.5-kb bins overlapping SUZ12 WT and MCM2-2A peaks. n = 3 biological replicates. Significant DO bins (red), FDR < 0.1, Bayes quasi-likelihood F test. j, Average crosslinked SCAR-seq profiles as in Fig. 1. IQR, interquartile range; NS, not significant.

