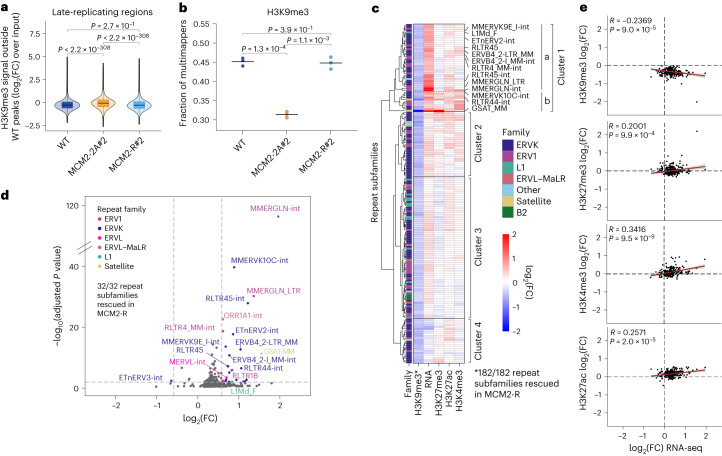
Fig. 3. Unscheduled H3K9me3 gains in late-replicating regions and loss of H3K9me3-mediated repeat repression in MCM2-2A cells.
a, H3K9me3 ChIP–seq signal in 5-kb bins outside WT peaks focused on late-replicating regions. Two-sided Wilcoxon signed-rank test. b, Fraction of multimapping reads for H3K9me3 ChIP–seq. n = 3 biological replicates. Horizontal lines represent mean values. Two-sided paired t test. c, Repeat subfamilies with significant H3K9me3 loss in MCM2-2A#2, (n = 182 repeat subfamilies) FDR < 0.01, Wald test. Hierarchical clustering according to changes in H3K9me3, RNA, H3K27me3, H3K27ac and H3K4me3 levels between WT and MCM2-2A#2. Selected upregulated repeat subfamilies are labeled. *indicates the number of rescued H3K9me3 repeat subfamilies. d, Differential repeat expression between MCM2-2A#2 and WT. Significant subfamilies |log2(FC)| > 0.58, FDR < 0.01, Wald test (Supplementary Methods) are colored according to repeat family. n = 4 biological replicates. e, Correlation of RNA and histone PTM changes (log2(FC) MCM2-2A#2/WT) for repeat subfamilies with a significant change in RNA or histone PTMs (n = 124; FDR < 0.01). Two-sided Pearson’s correlation coefficient (R) with P value. Error bands, confidence intervals around the mean. FC, fold change.

