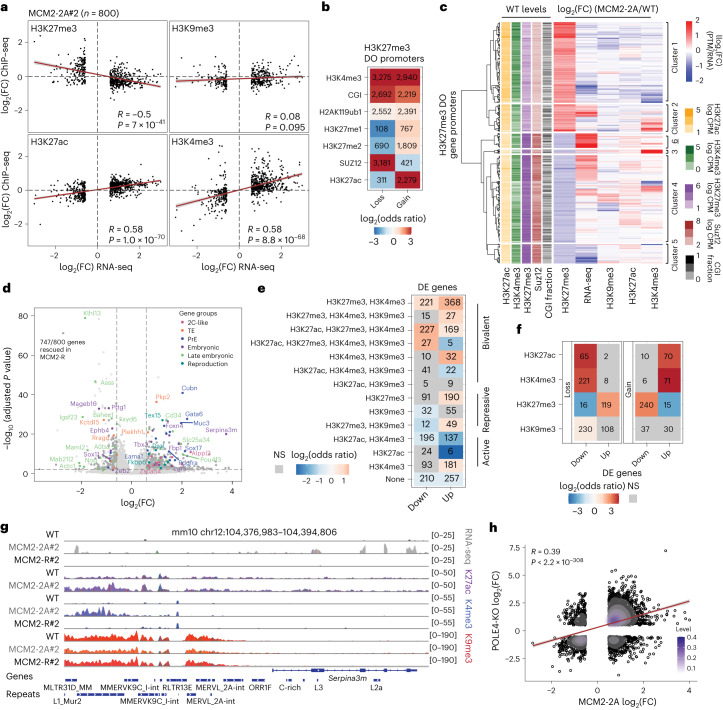
Fig. 4. Deregulation of H3K27me3 at bivalent promoters correlates with misexpression of developmental genes in MCM2-2A cells.
a, Correlation of RNA and histone PTM changes (log2(FC) MCM2-2A#2/WT) for DE genes (d, n = 800). Two-sided Pearson’s correlation coefficient (R) with P value. b, Enrichments (odds ratios) of chromatin feature overlapping H3K27me3 DO promoters. Significant enrichments (P < 0.001) are colored, and NS are in gray. Two-sided Fisher’s exact test. c, Hierarchical clustering of H3K27me3 DO promoters according to changes in H3K27me3, RNA, H3K9me3, H3K27ac, H3K4me3 between MCM2-2A#2 and WT. WT levels of H3K27ac, H3K4me3, H3K27me3, SUZ12 and CGI are included on the left. n = 3,170 H3K27me3 DO promoters. d, Differential gene expression between MCM2-2A#2 and WT cells. Significant genes are depicted in dark gray (FDR < 0.01 and |log2(FC)| > 0.58, Wald test), and nonrescued genes are depicted in light gray. Selected genes related to enriched GO terms are colored (Extended Data Fig. 7j). FC against FDR is shown per gene. n = 4 biological replicates. e, Enrichment (odds ratios) of chromatin states around transcription start sites (TSSs) of upregulated and downregulated genes. Significant enrichments are colored (log odds ratio; two-sided Fisher’s exact test, P < 0.05), and NS states are in gray. f, Histone PTM losses or gains (DO, FDR < 0.01) in DE gene promoters (from d). Significant enrichments (P ≤ 0.01; two-sided Fisher’s exact test) are colored, and NS states are in gray. g, Example region showing upregulation of the Serpina3m gene and repeats located within 10 kb, including RNA-seq, H3K27ac, H3K4me3 and H3K9me3 normalized signal. Chr12: 104376983–104394806. h, Correlation of gene expression changes (log2(FC) over WT) in POLE4-KO and MCM2-2A histone recycling mutants. Single genes and gene densities are represented by black circles and purple color gradient, respectively. Two-sided Pearson’s correlation coefficient (R) with P value.

