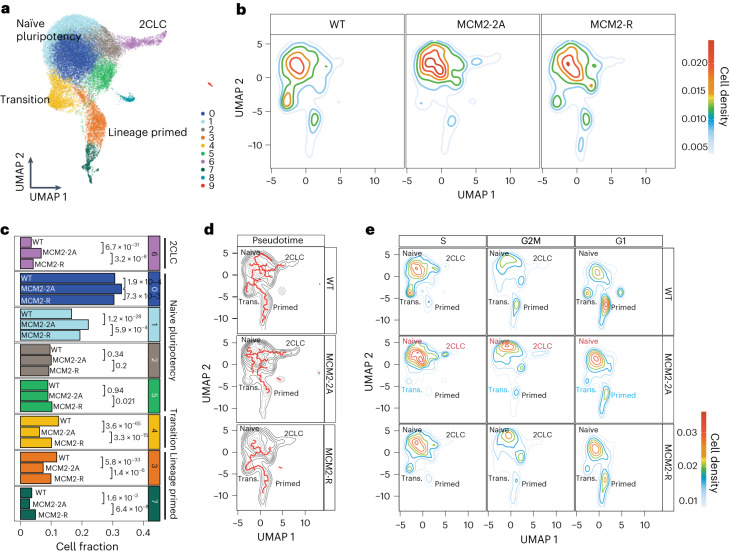
Fig. 5. MCM2-2A mutation challenges cell-state transitions.
a, UMAP showing clustering analysis and annotations of WT, MCM2-2A and MCM2-R cells. b, WT, MCM2-2A and MCM2-R cells projected on the common UMAP. Colored lines represent cell density. c, Relative abundance of main subpopulations shown in a for each cell line. P values were derived from chi-square tests comparing cell counts for the clusters of interest with the cell counts of all other clusters. n = number of cells; WT (n = 15,181), MCM2-2A#2 (n = 15,488) examined over two biological replicates, MCM2-R#2 (n = 4487). d, Pseudotime analysis showing main trajectories between clusters. e, Cell-cycle-separated single cells projected on UMAP. Colored lines represent cell density.

