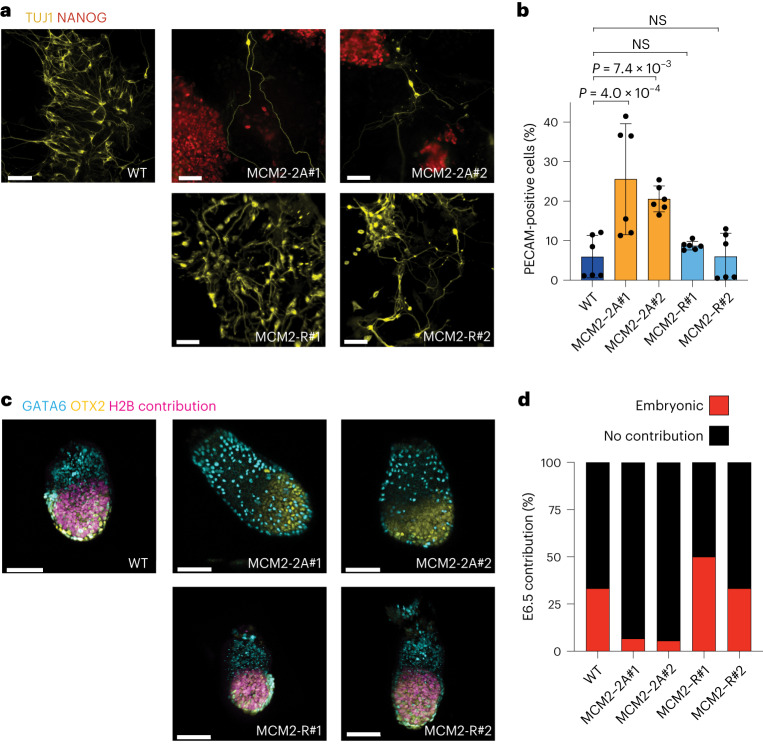
Fig. 6. MCM2-2A mutation impairs embryonic differentiation.
a, Representative immunofluorescence (IF) images of neuronal differentiation (day 7). Scale bar, 70 μm. b, Bar plots depicting mean ± standard deviation (s.d.) of PECAM-1-positive cells quantified by flow cytometry at day 7 of neuronal differentiation. One-way ANOVA statistical test. n = 6 biological replicates. Dots represent individual data points. c, Representative IF images of chimeric embryos from single-cell injected morulae dissected at E6.5. Scale bar, 50 μm. The images are stacks of multiple fields. d, Quantification of chimera contribution at E6.5. n = number of embryos; WT (n = 18), MCM2-2A#1 (n = 15), MCM2-2A#2 (n = 18), MCM2-R#1 (n = 20) and MCM2-R#2 (n = 15). ANOVA, analysis of variance.

